NCL scripts for plotting WRF data
[Main page | Scripts]Note: the scripts on this page are meant to be used as a set of step-by-step examples for the NCL Workshop being held at ARSC/UAF, March 11-15, 2013. Some of these scripts are very basic and not appropriate for real-world use. If you want to use the scripts on this page, we recommend using the ones with the higher numbers; for example, "wrf_gsn_t_8.ncl" rather than "wrf_gsn_t_1.ncl".
Sean Egan provided NetCDF file used for these plots, "wrfout_d01_2008-08-09_00:00:00.nc".
[Click on any image to see a larger version.]
| This set of scripts compares three ways of generating the same plot: using wrf_xxxx plotting scripts, using gsn_csm_xxxx plotting scripts, and using PyNGL and PyNIO. | ||
| wrf_xxxx | gsn_csm_xxxx | PyNGL/PyNIO |
|---|---|---|
wrf_hgt.ncl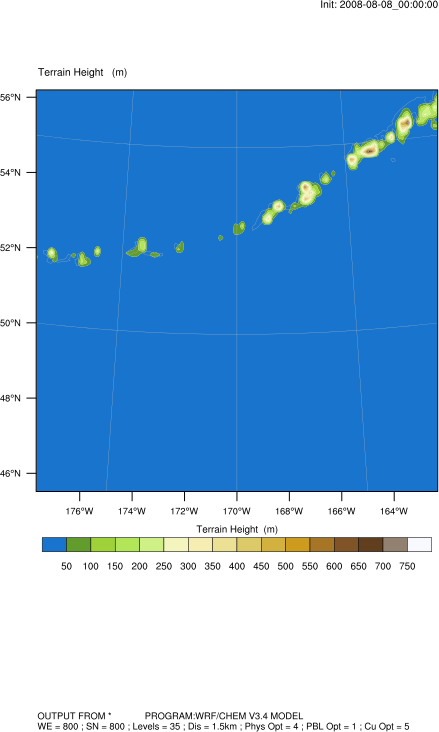
| wrf_gsn_hgt_9.ncl
| wrf_ngl_hgt.py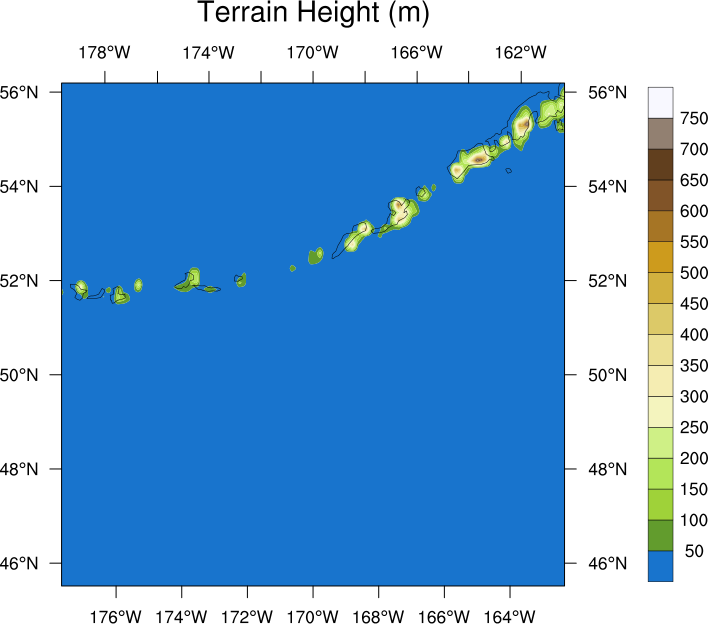
|
| This set of examples plots temperature from a WRF file. | |
wrf_ll_to_ij.ncl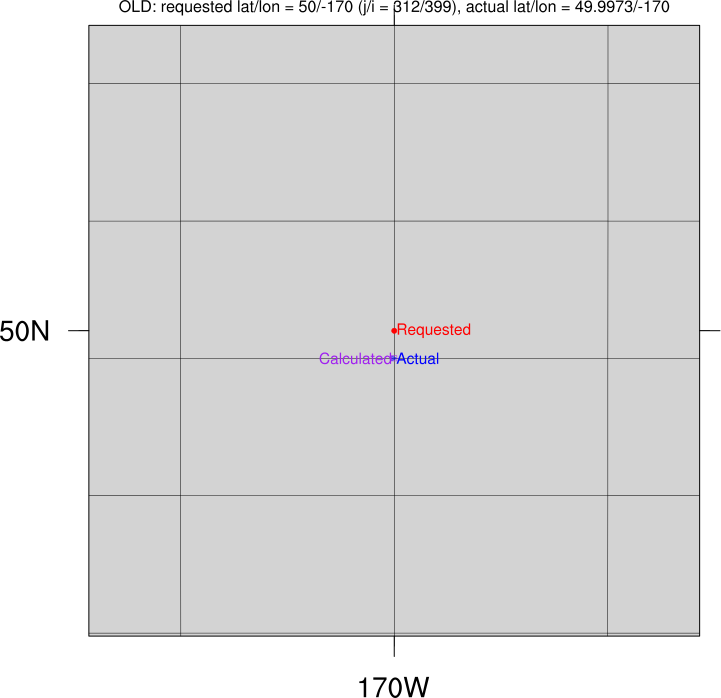 
| |
| This set of examples plots temperature from a WRF file. It compares the wrf_xxxx scripts with the gsn_csm_xxxx scripts. The wrf_t_n.ncl scripts use wrf_xxxx plotting functions, and the wrf_gsn_t_n.ncl scripts use gsn_csm_xxxx plotting functions, | |||
wrf_t_1.ncl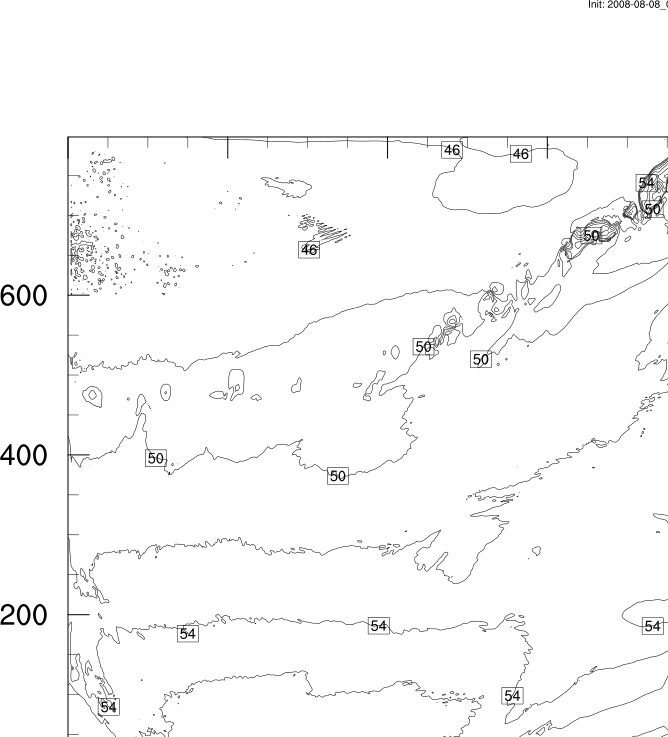
| wrf_gsn_t_1.ncl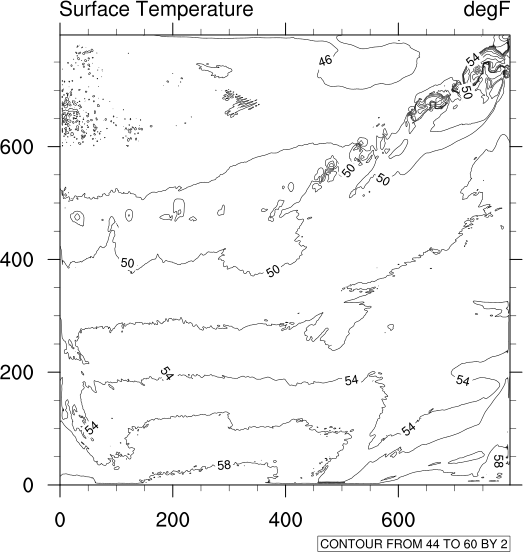
| wrf_t_2.ncl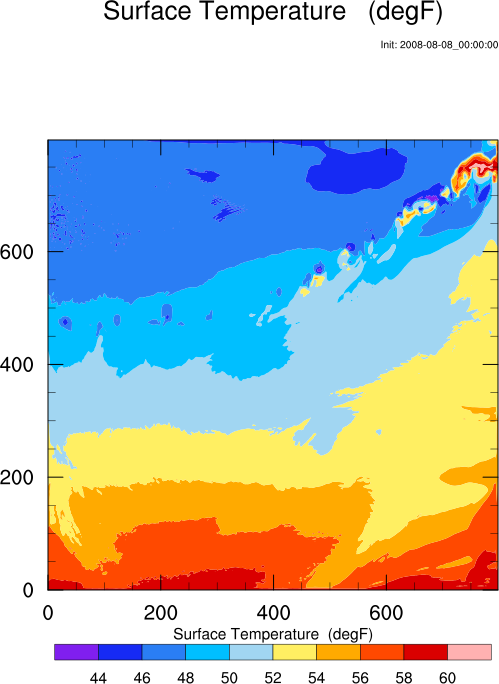
| wrf_gsn_t_2.ncl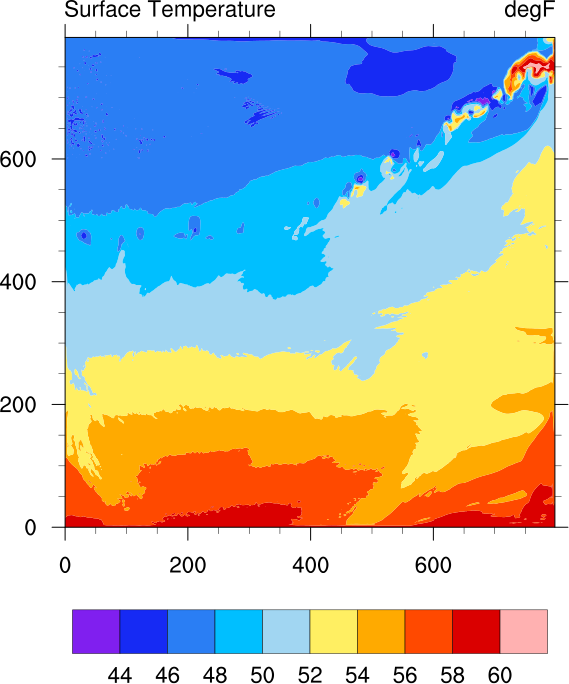
|
wrf_t_3.ncl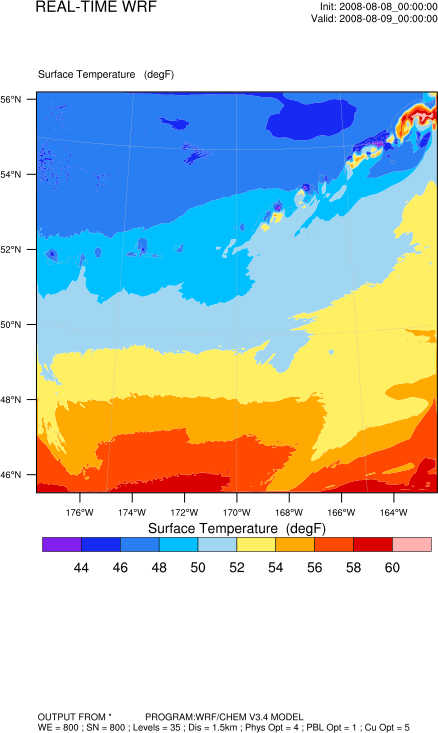
| wrf_gsn_t_3.ncl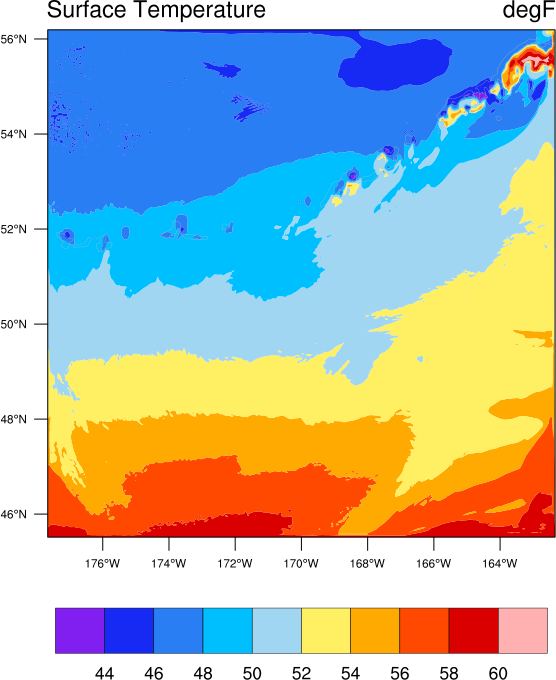
| No more wrf_xxxx versions of this script. | |
wrf_gsn_t_4.ncl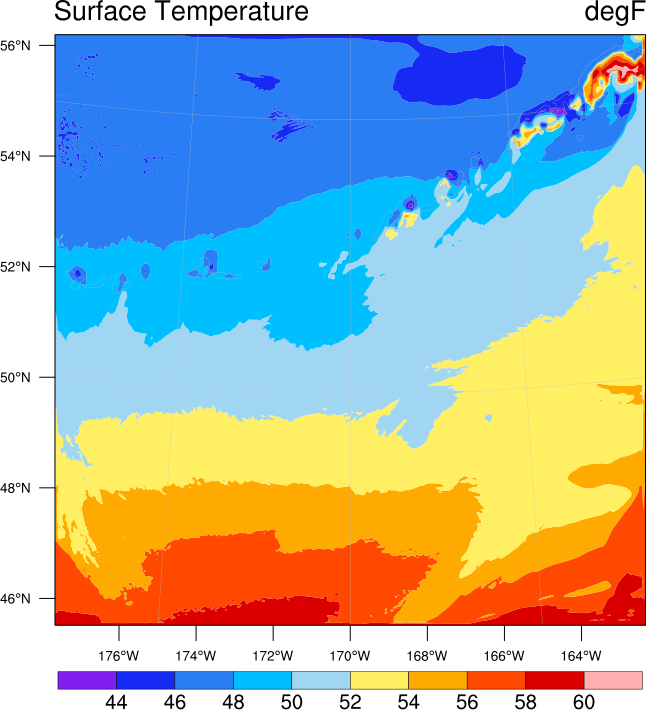
| wrf_gsn_t_5.ncl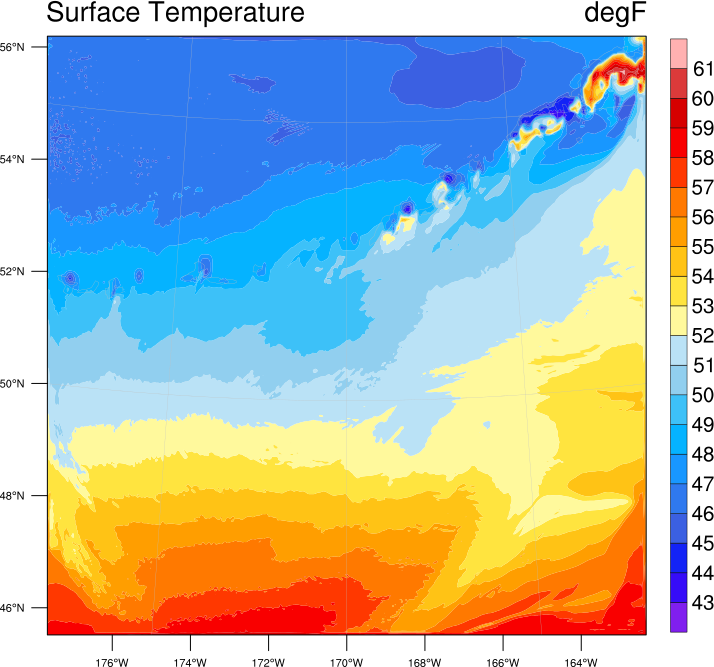
| wrf_gsn_t_6.ncl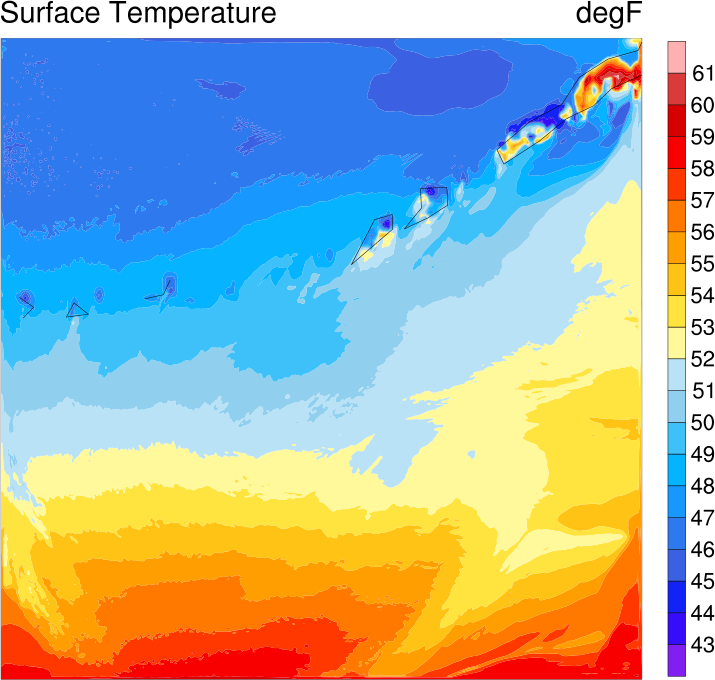
| wrf_gsn_t_7.ncl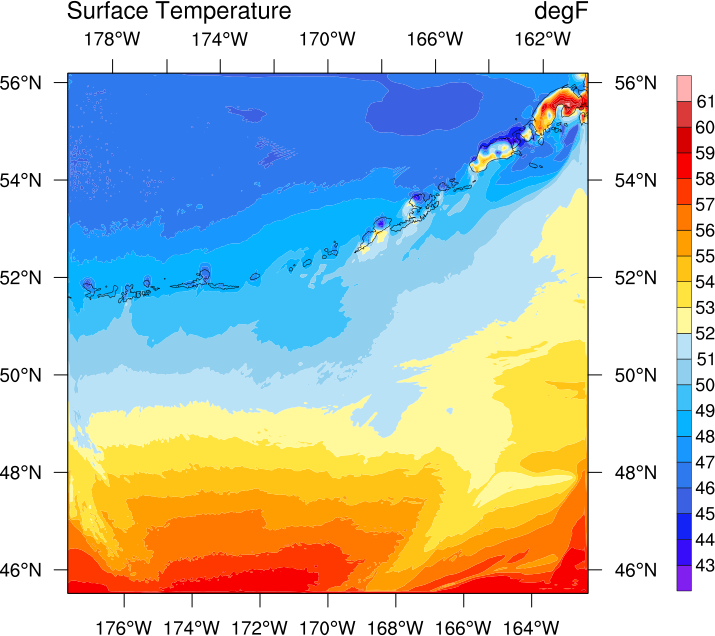
|
wrf_gsn_t_8.ncl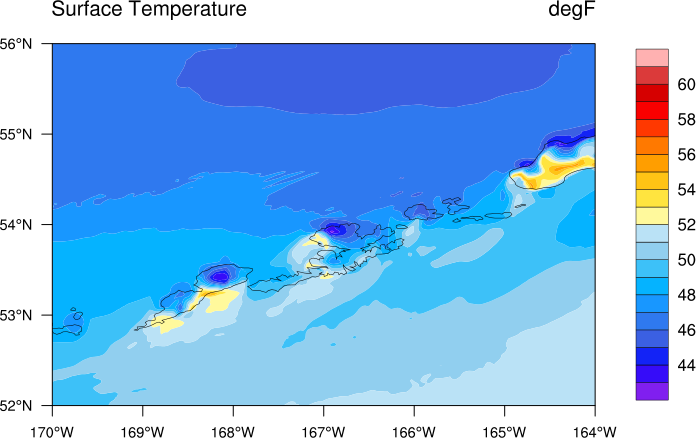
| wrf_gsn_t_9.ncl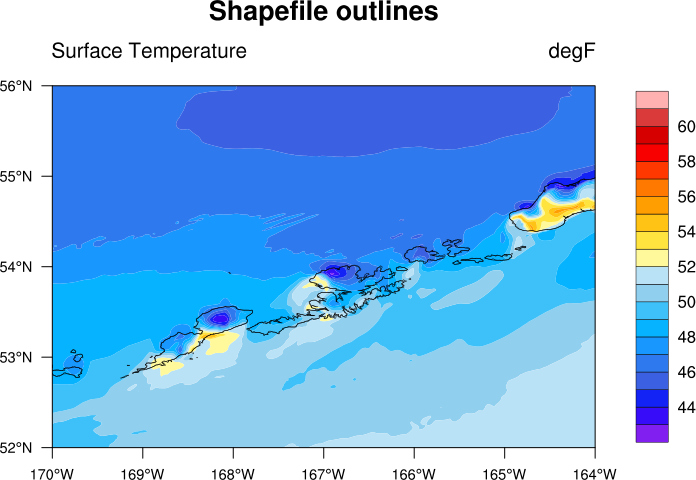
| ||
| This example plots wind barbs over temperature over sea
level pressure over a map. It compares the wrf_xxxx scripts with the gsn_csm_xxxx scripts. | |
| wrf_xxxx | gsn_csm_xxxx |
|---|---|
wrf_t_slp_uv.ncl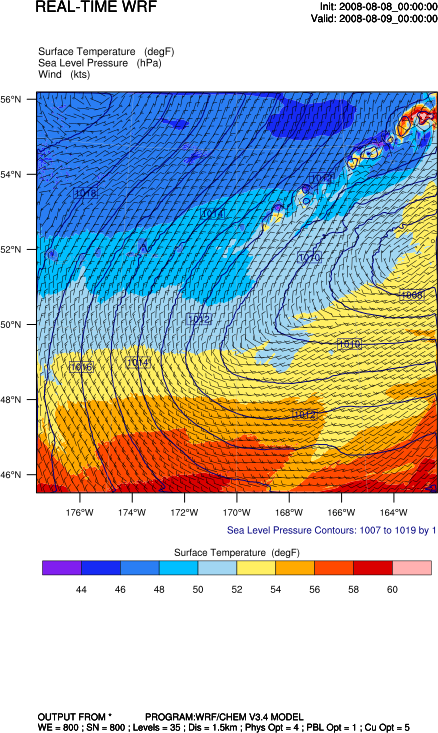
| wrf_gsn_t_slp_uv.ncl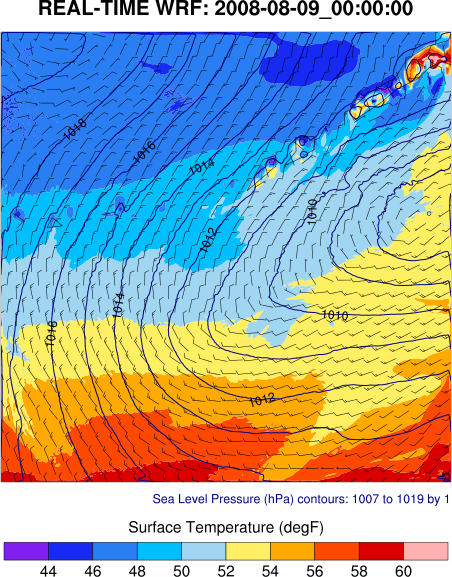
|
| This set of examples plots height from a WRF file.
It only uses gsn_csm_xxxx plotting scripts. The last example shows how to add shapefile outlines. | |||
wrf_gsn_hgt_1.ncl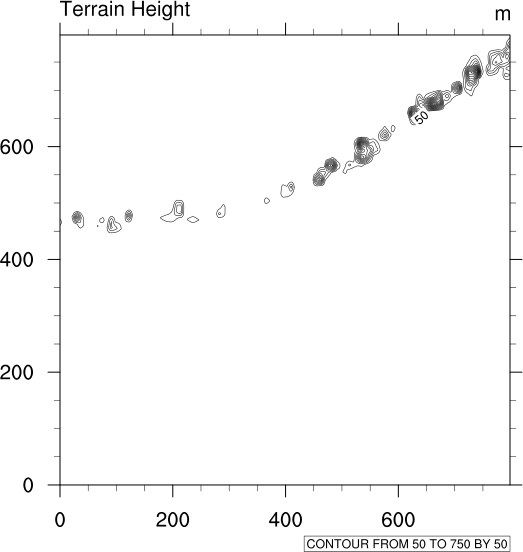
| wrf_gsn_hgt_2.ncl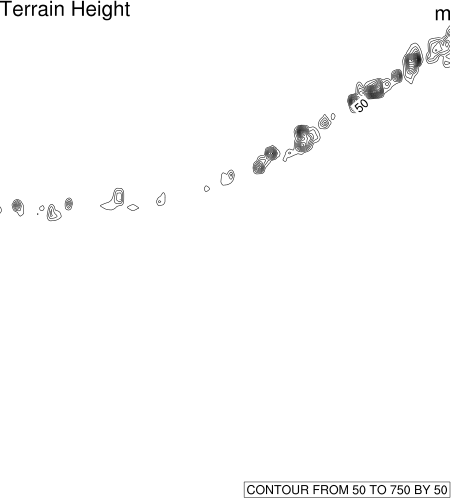
| wrf_gsn_hgt_3.ncl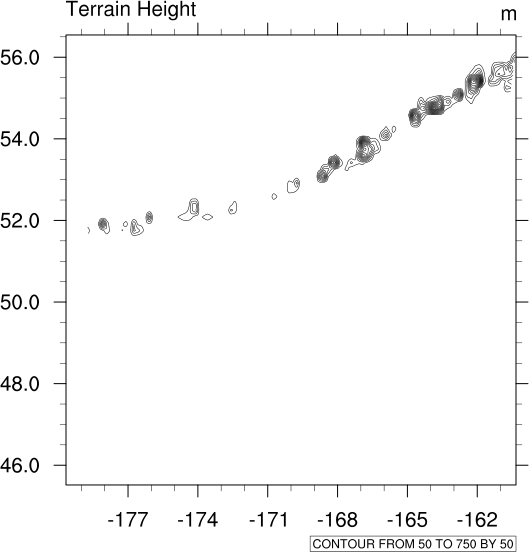
| wrf_gsn_hgt_4.ncl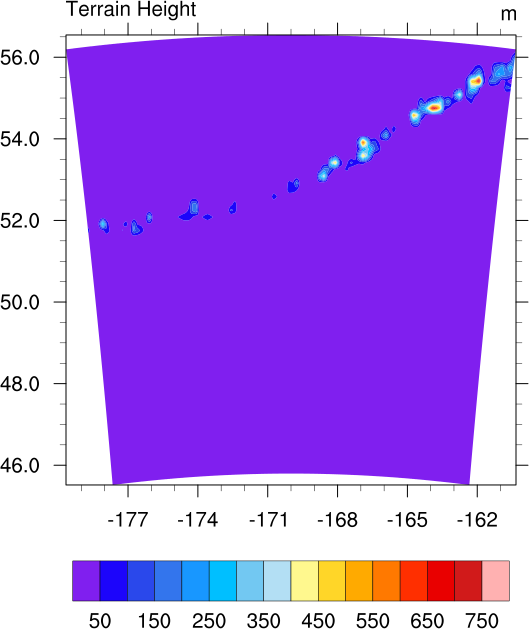
|
wrf_gsn_hgt_5.ncl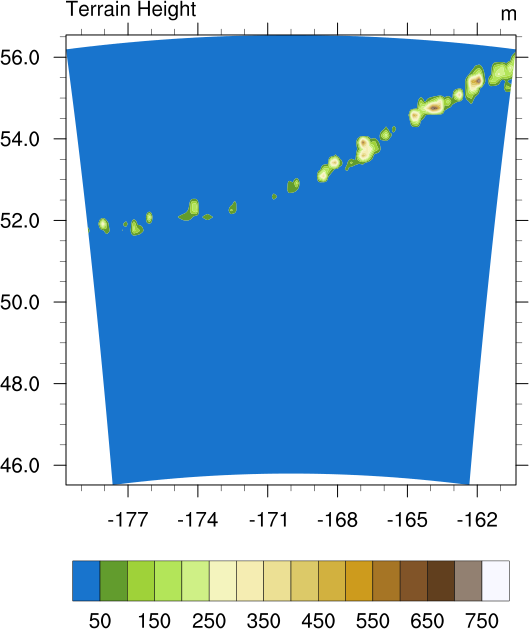
| wrf_gsn_hgt_6.ncl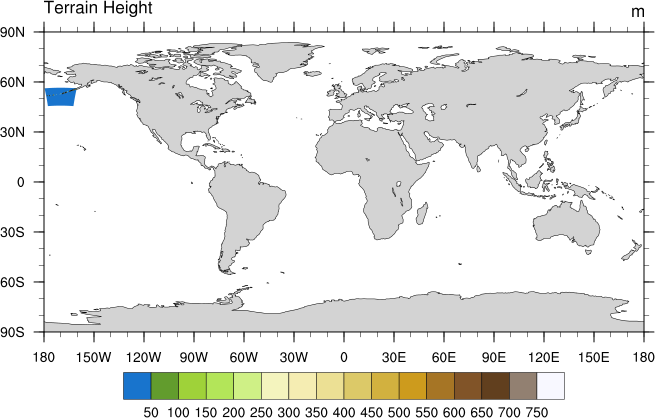
| wrf_gsn_hgt_7.ncl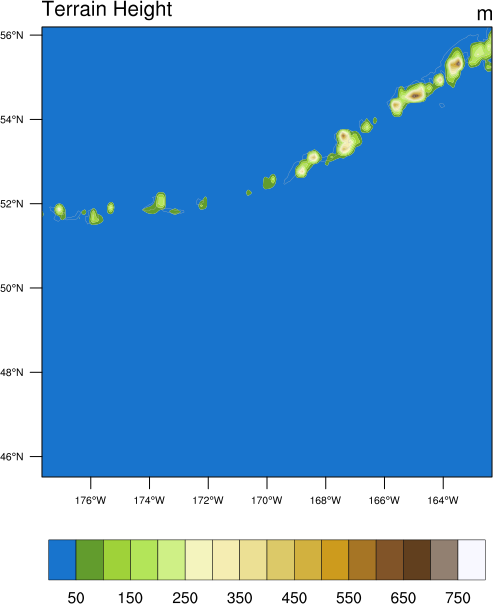
| wrf_gsn_hgt_8.ncl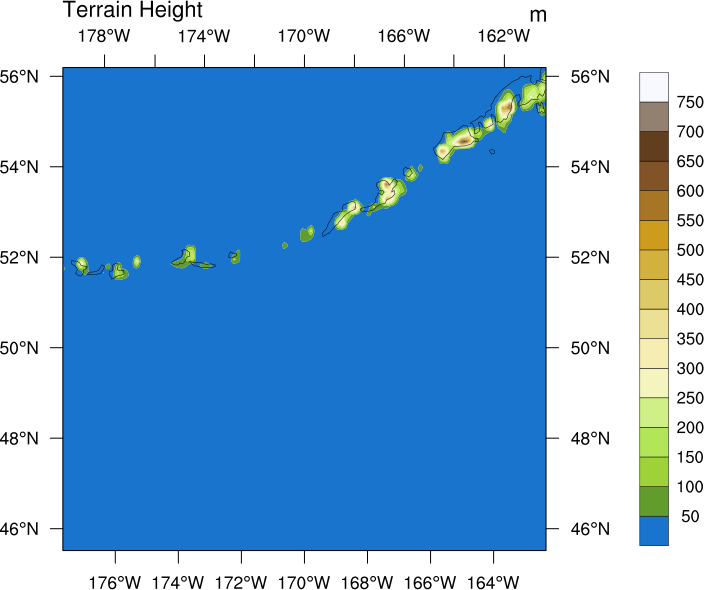
|
| wrf_gsn_hgt_9.ncl
| wrf_gsn_hgt_10.ncl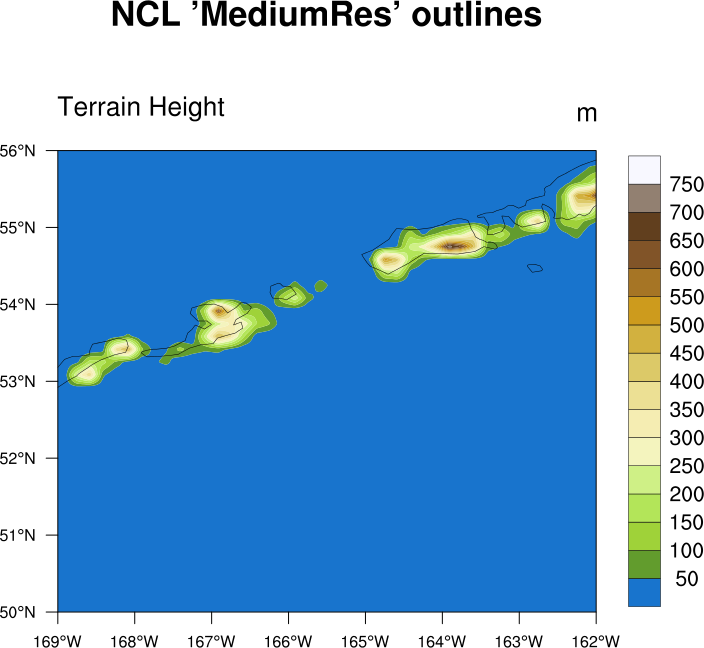 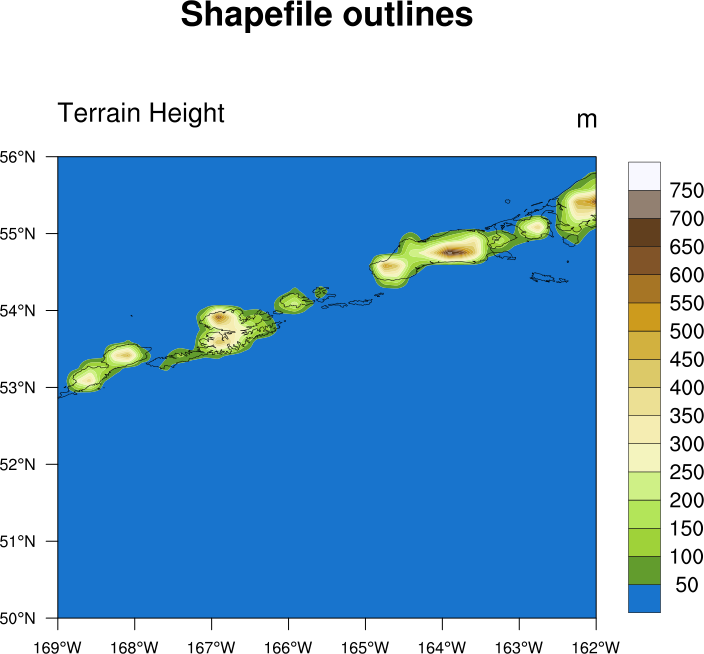
| wrf_gsn_hgt_11.ncl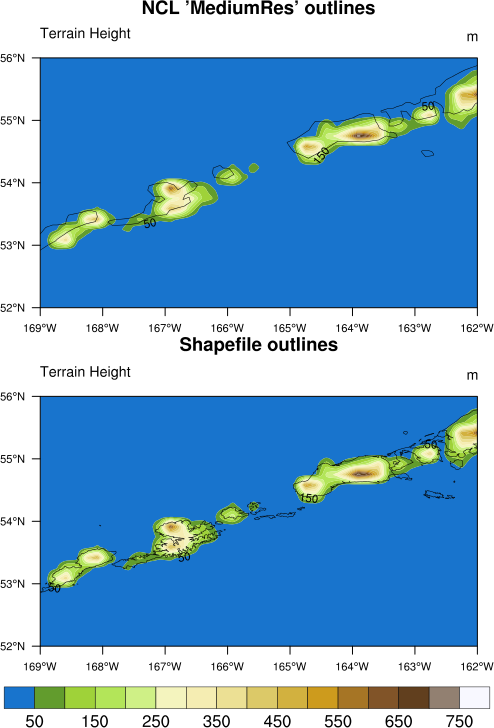
| |