NCL Home>
Application examples>
generic graphical interfaces ||
Data files for some examples
Example pages containing:
tips |
resources |
functions/procedures
NCL Graphics: Vector over Scalars (generic high-level plot interfaces)
Vector over Scalar Type Plot Templates
gsn_vector_scalar
gsn_vector_scalar_map
These functions create very generic vector/scalar plots.
We recommend that you use the more customized functions:
gsn_csm_vector_scalar
gsn_csm_vector_scalar_map
for creating vector/scalar plots.
See the "vectors" examples page for
more customized vector plots.
 gsn_vec_scal_1.ncl
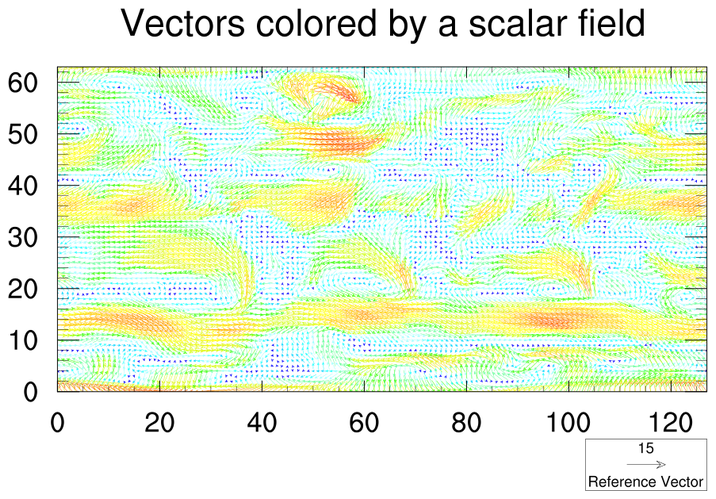
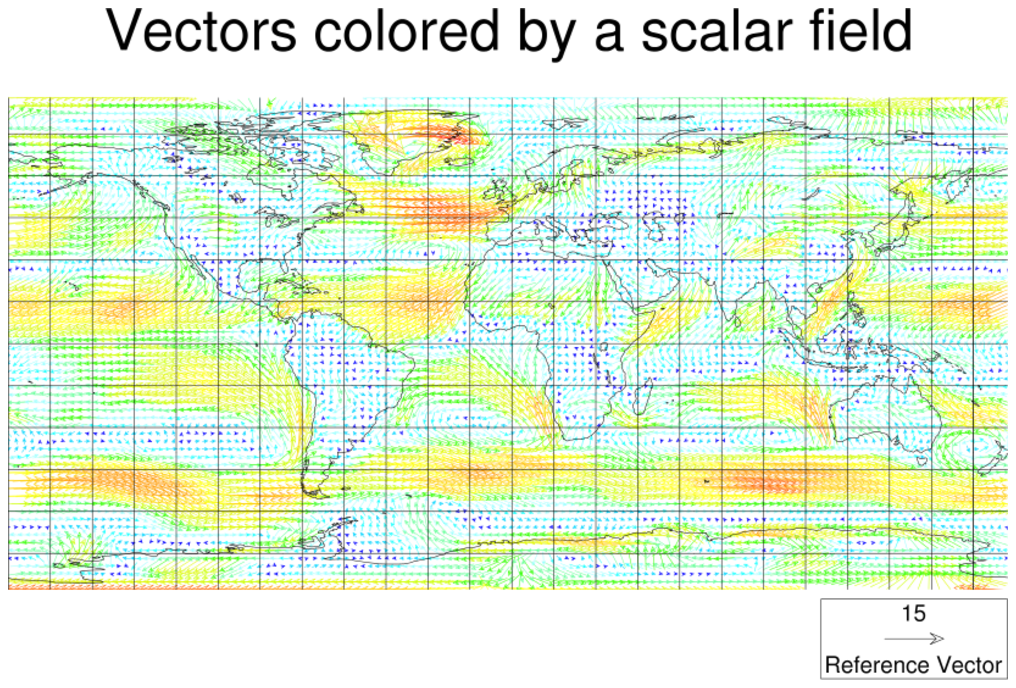
:
Vectors colored by a scalar field.
gsn_vector_scalar is the generic
plot interface that creates vector scalar plots.
vcRefMagnitudeF = 15.0,
Defines the reference vector magnitude. Use this to adjust the
size of the vectors.
vcRefLengthF = 0.045, Defines
the length of the reference vectors.
 gsn_vec_scal_2.ncl
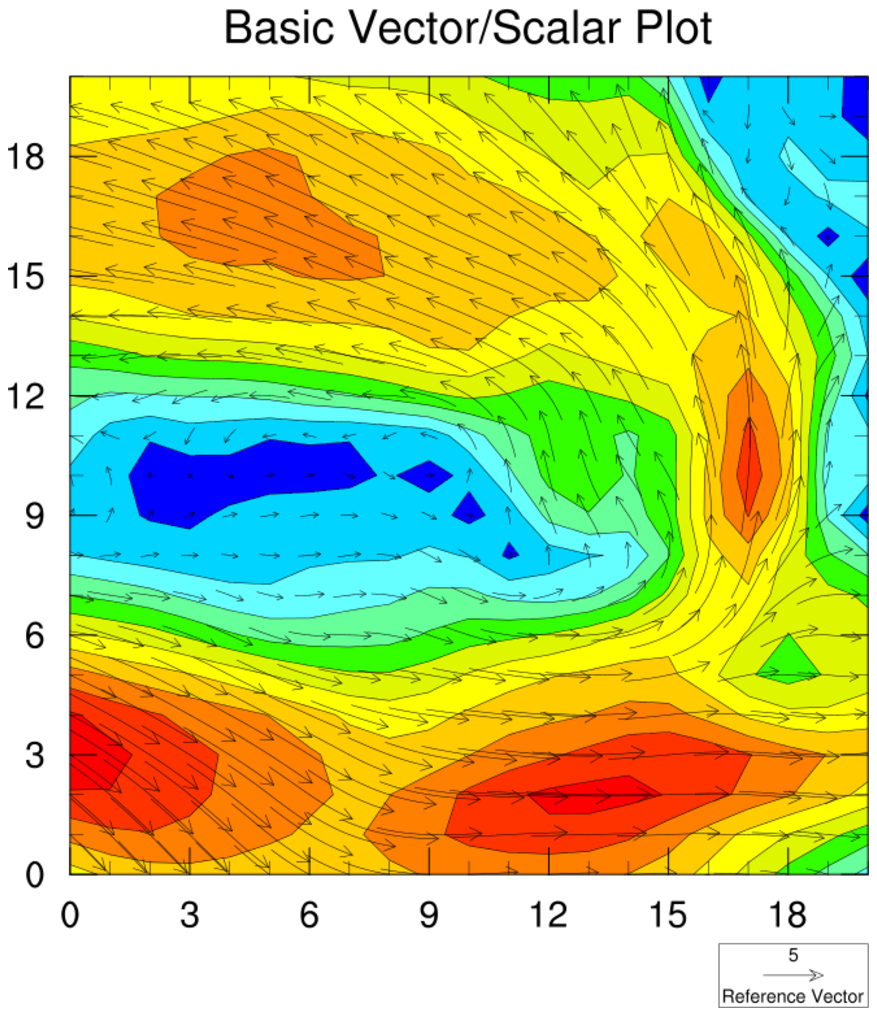
:
Creates a contour plot and a separate vector plot and then
overlays them.
gsn_vector
is the generic plot interface that creates vector plots.
gsn_contour
is the generic plot interface that creates contour plots.
See gsn_contour_3.ncl for how to
add a colorbar to this plot.
 gsn_vec_scal_3.ncl
:
Vectors colored by a scalar field and overlaid on a map.
gsn_vector_scalar_map
is the generic plot interface that creates vector plots over the
cylindrical equidistant map projection..