NCL Home>
Application examples>
Plot techniques ||
Data files for some examples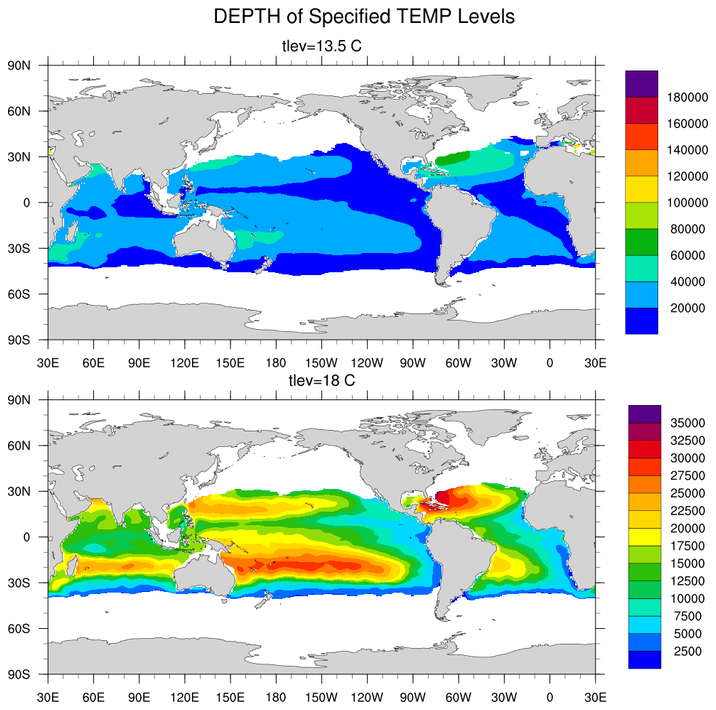
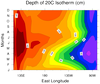
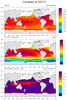
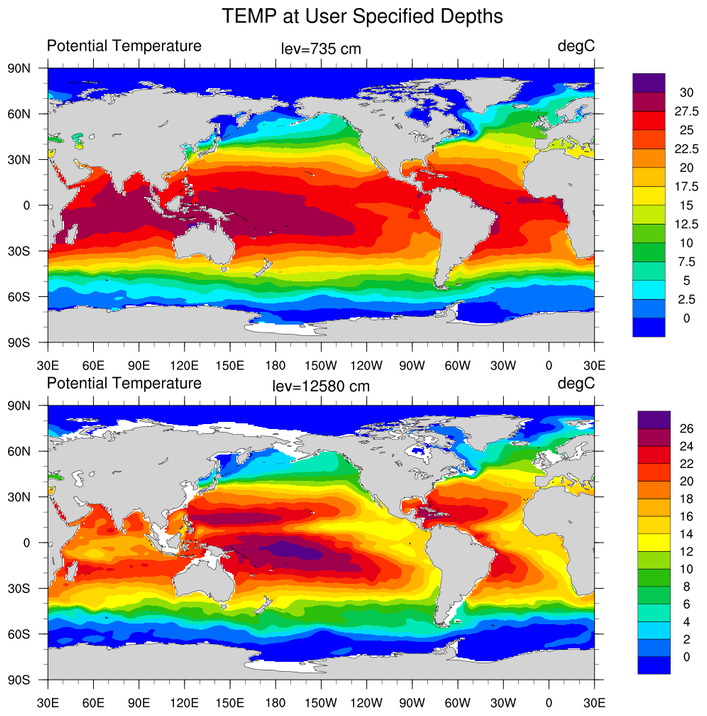
 iso_1.ncl:
Determine (a) the temperatures at user specified depths;
(b) the depths at which user specified temperatures occur.
iso_1.ncl:
Determine (a) the temperatures at user specified depths;
(b) the depths at which user specified temperatures occur.
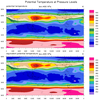
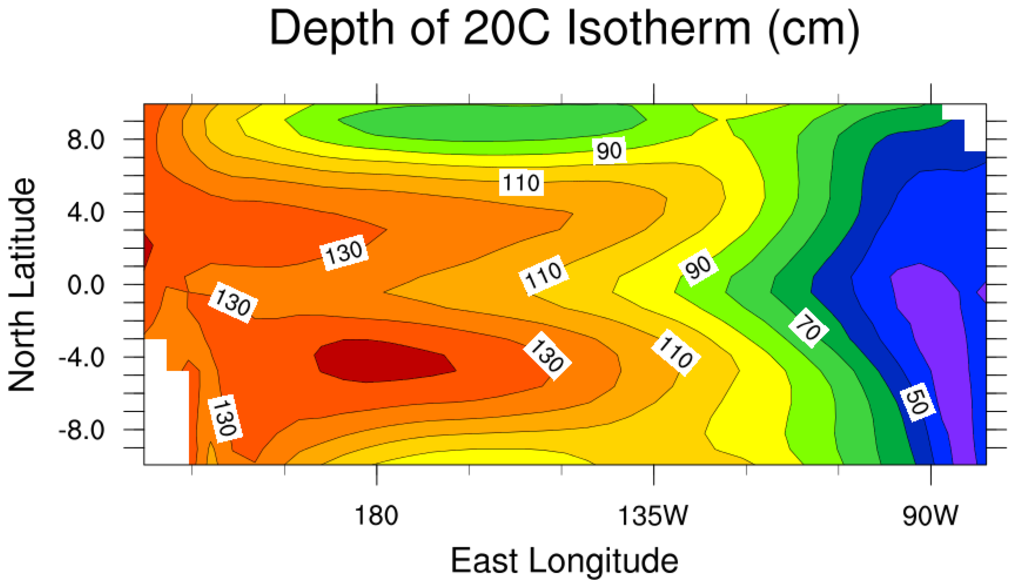
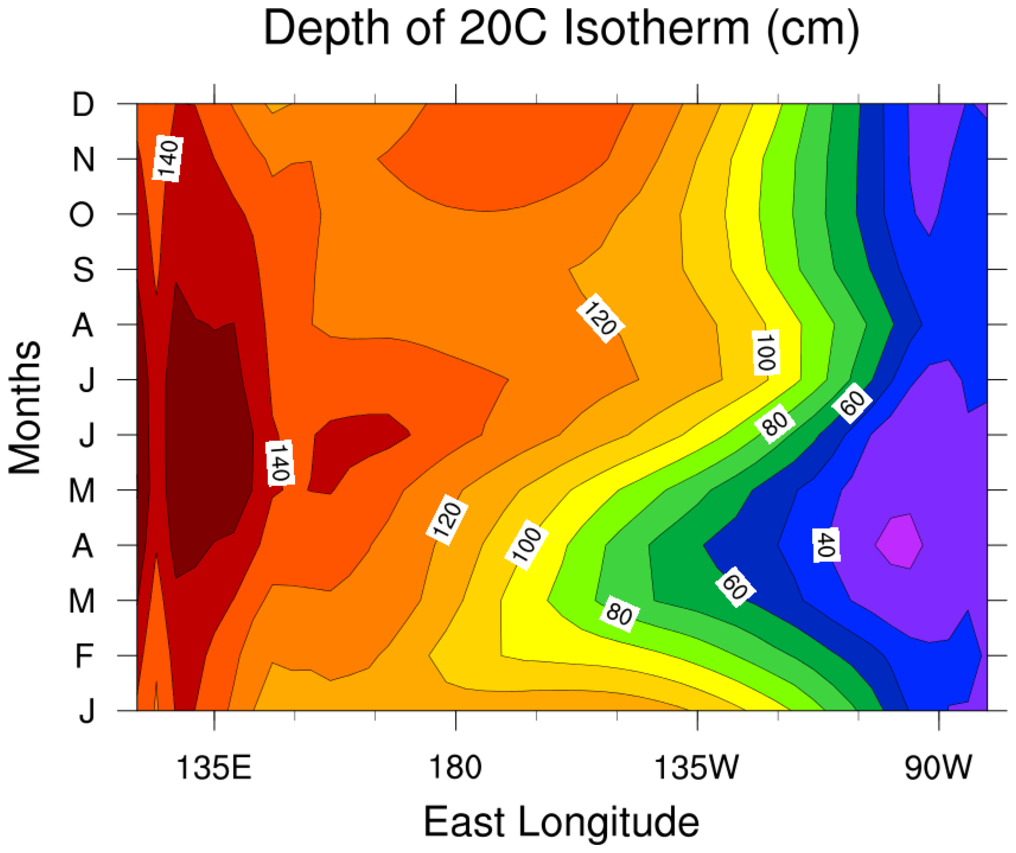
 iso_2.ncl:
Calculates a climatology and uses dimension
reduction to extract areas of interest for plotting.
iso_2.ncl:
Calculates a climatology and uses dimension
reduction to extract areas of interest for plotting.
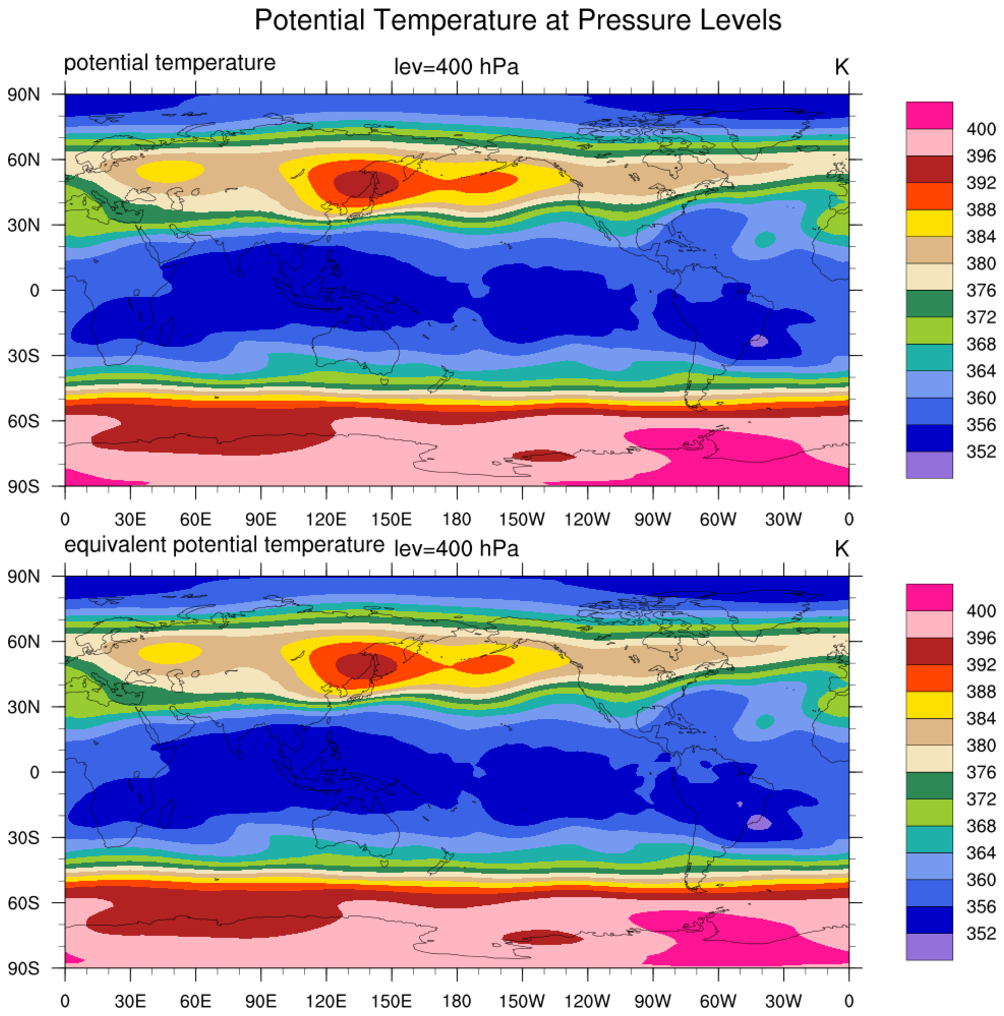
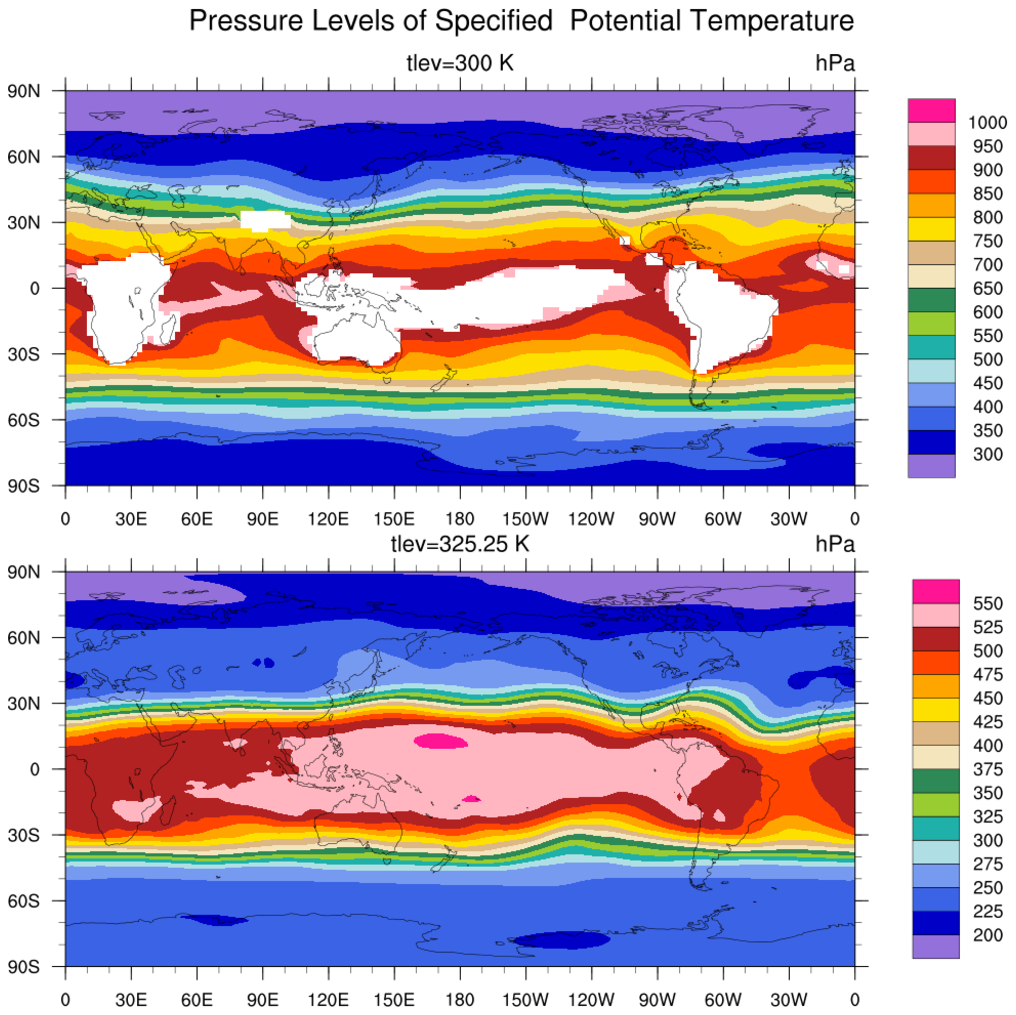
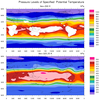 iso_3.ncl:
Calculate potential temperature and equivalent potential temperature
on hybrid levels: (a) interpolate to user specified pressure levels,
(b) linearly interpolate from the hybrid levels to determine the pressure
levels at which specified potential temperatures occur.
iso_3.ncl:
Calculate potential temperature and equivalent potential temperature
on hybrid levels: (a) interpolate to user specified pressure levels,
(b) linearly interpolate from the hybrid levels to determine the pressure
levels at which specified potential temperatures occur.
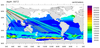
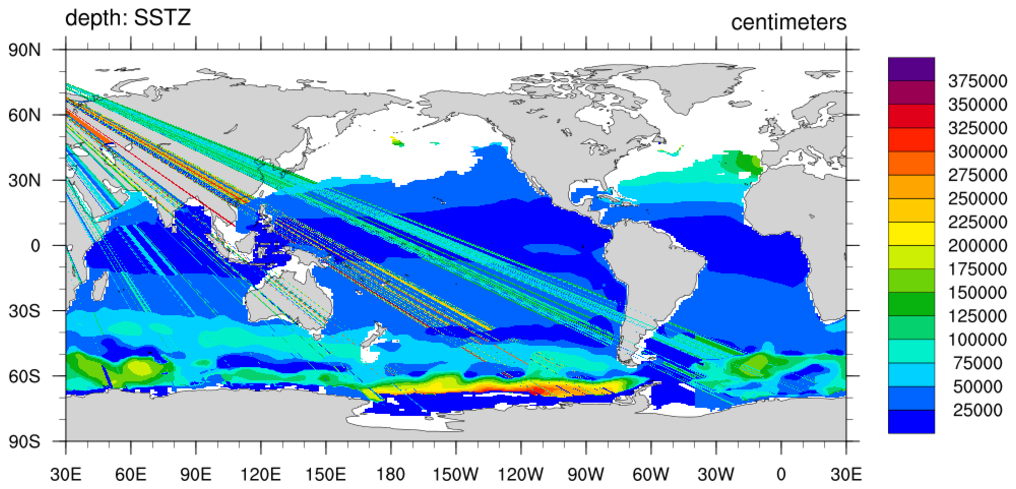
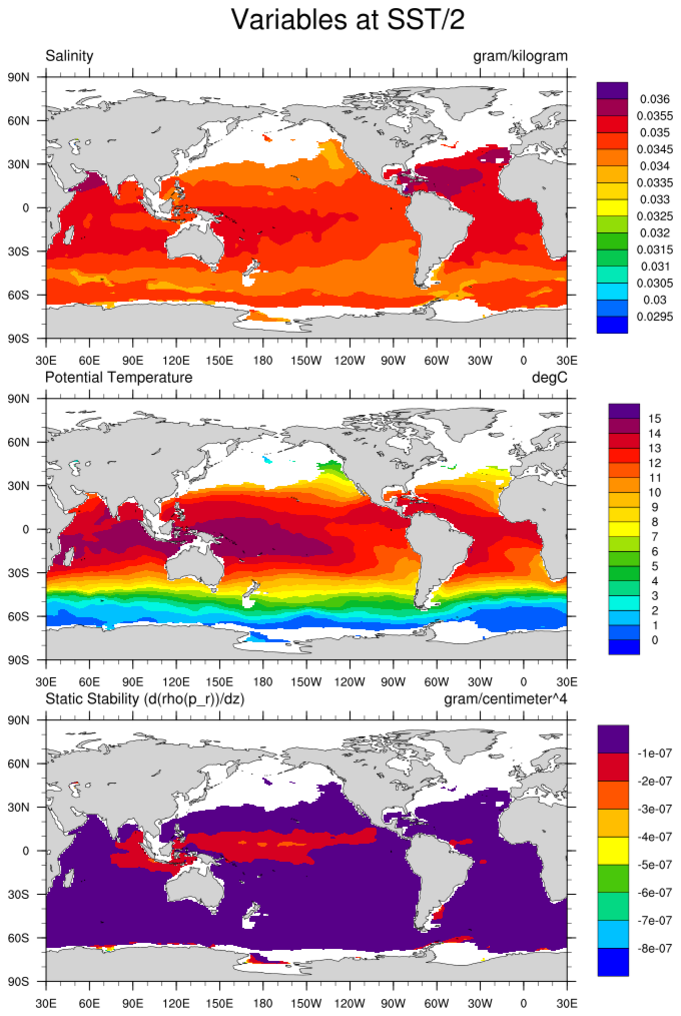
 iso_4.ncl:
Note: the first image generated by this script is incorrect. We
have not had a chance to debug this yet. The second image is fine.
iso_4.ncl:
Note: the first image generated by this script is incorrect. We
have not had a chance to debug this yet. The second image is fine.
Example pages containing: tips | resources | functions/procedures
NCL Graphics: Isosurfaces
These use the int2p_n_Wrap function.
The linint1_n_Wrap could also be used.
Also see: isentropic interpolation
for other generically related examples.
 iso_1.ncl:
Determine (a) the temperatures at user specified depths;
(b) the depths at which user specified temperatures occur.
iso_1.ncl:
Determine (a) the temperatures at user specified depths;
(b) the depths at which user specified temperatures occur.
 iso_2.ncl:
Calculates a climatology and uses dimension
reduction to extract areas of interest for plotting.
iso_2.ncl:
Calculates a climatology and uses dimension
reduction to extract areas of interest for plotting.
 iso_3.ncl:
Calculate potential temperature and equivalent potential temperature
on hybrid levels: (a) interpolate to user specified pressure levels,
(b) linearly interpolate from the hybrid levels to determine the pressure
levels at which specified potential temperatures occur.
iso_3.ncl:
Calculate potential temperature and equivalent potential temperature
on hybrid levels: (a) interpolate to user specified pressure levels,
(b) linearly interpolate from the hybrid levels to determine the pressure
levels at which specified potential temperatures occur.
 iso_4.ncl:
Note: the first image generated by this script is incorrect. We
have not had a chance to debug this yet. The second image is fine.
iso_4.ncl:
Note: the first image generated by this script is incorrect. We
have not had a chance to debug this yet. The second image is fine.
This script was developed in response to an ncl-talk question. Specifically:
   I have several ocean variables on 4-d (t, lev, lat, lon).
   I want to:

   1. Determine the depth at which the temperature (t, lev, lat, lon)
      equals half the value of SST (t, lat, lon). So the new variable have
      dimension (t, lat, lon) containing various depths from the grids.

   2. Using the new variable from (1), I'd like to extract other variables
      corresponding to the depths and other dimensions in (1).

   From the iso examples,
   I know that linear interpolation is used to get the depth of value. My problem is that
   the value I'm interested in (1/2 SST) will change from grid point to grid point.
In this case, explicit 'do loops' must be used. For a variable dimensioned
(1,40,384,320) and target (1,384,320), it took about 15 seconds for each
interpolated variable. Quite a bit slower than an array-based function.
Still, sometimes you have to use loops.