NCL Home> Application examples> Special plots || Data files for some examples

Example pages containing: tips | resources | functions/procedures

NCL Graphics: Pie Charts

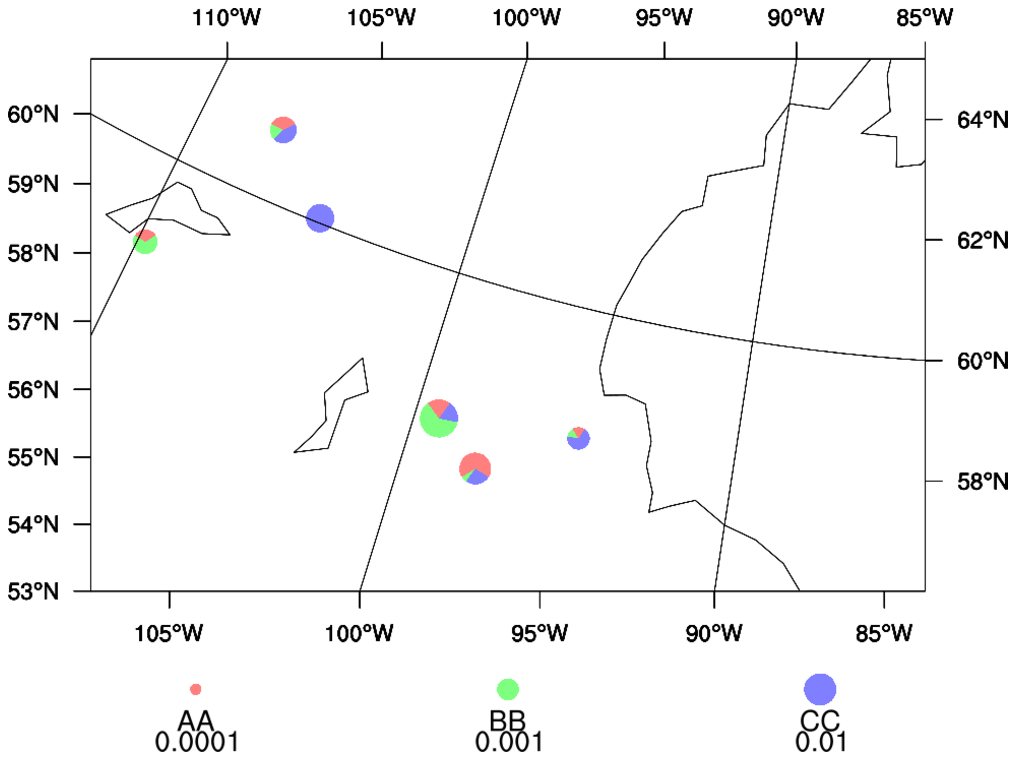
The Pie Chart can be viewed as an alternative to a Bar Chart or Histogram.

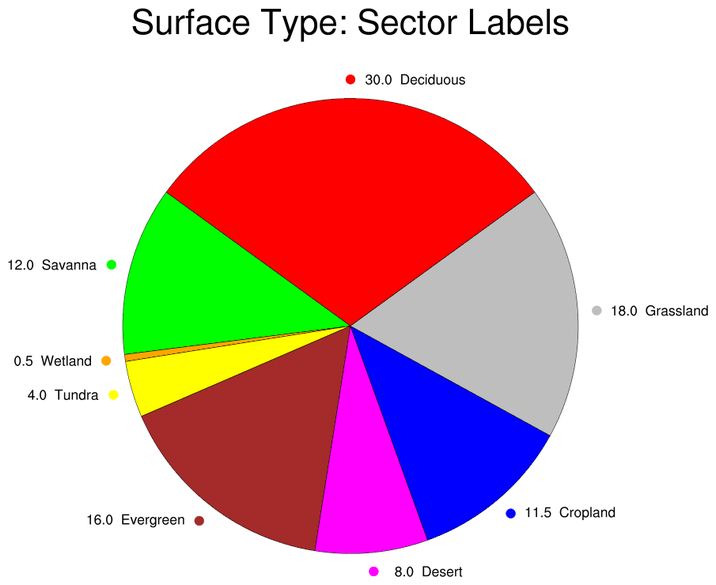
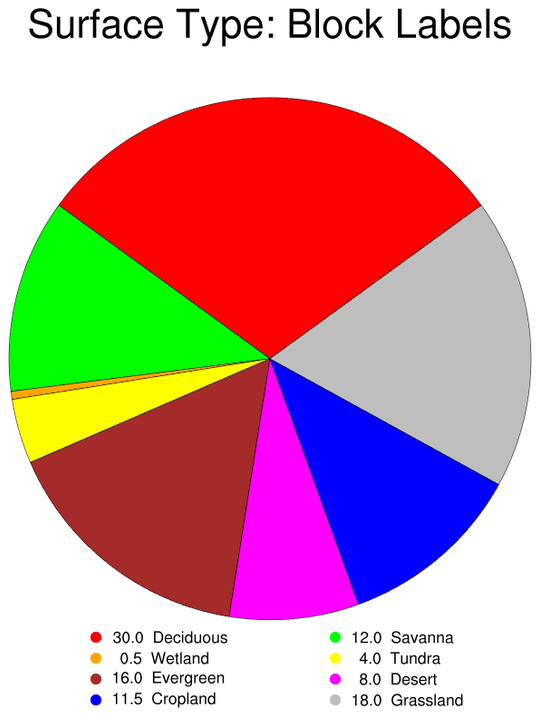
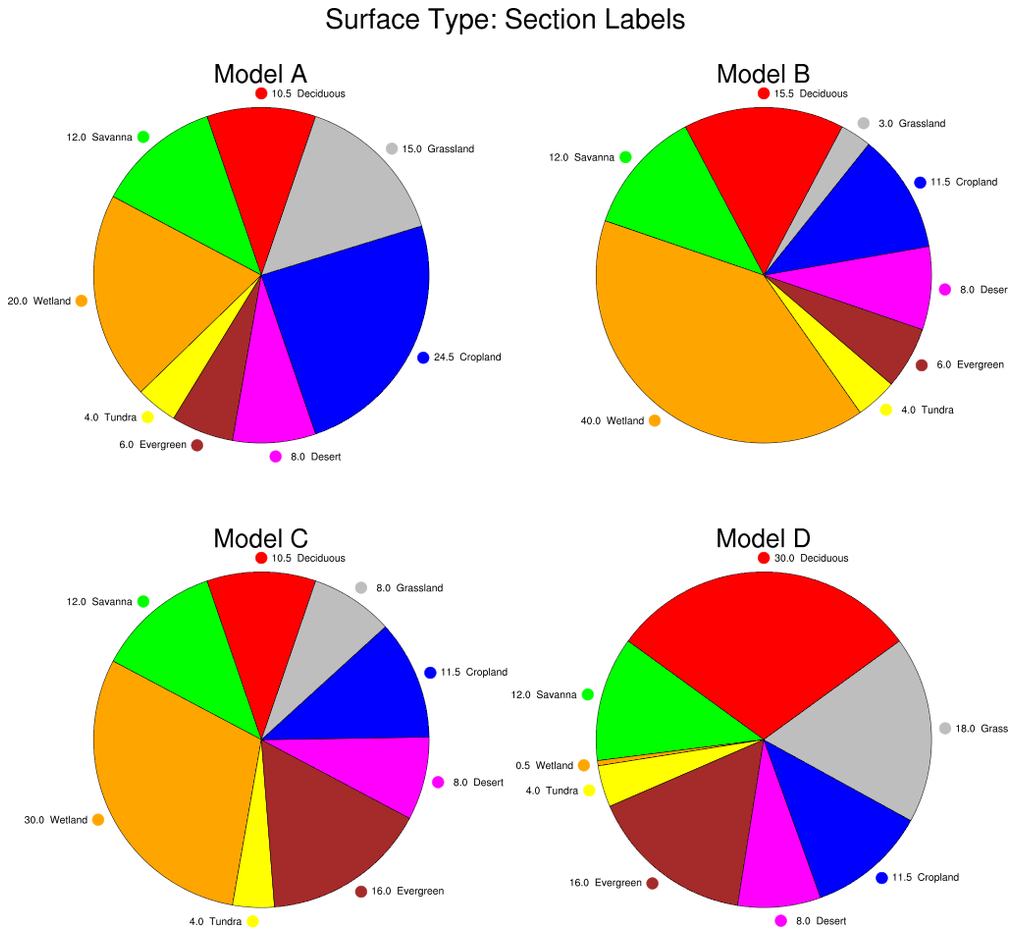
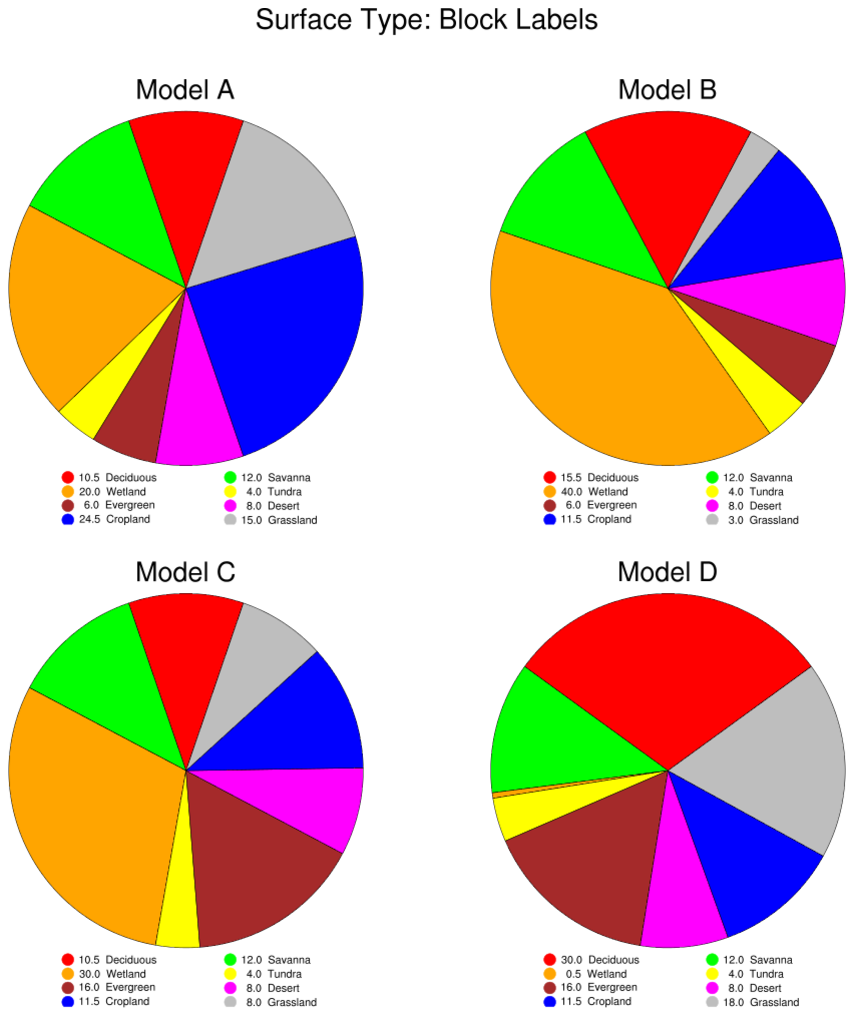
As illustrated below there are two Pie Chart labeling options: (i) "section" and (ii) "block". These may be changed by setting the "pcLabelType" attribute to either string. The default is "section".

pie_chart_1.ncl: The function pie_chart creates and draws a basic Pie Chart . There are two options on how the labels are attached to the graphic.
pie_chart_2.ncl: Demonstrates how to create a panel plot with different labeling options.

pie_chart_3.ncl: Demonstrates adding pie charts to a map. This script was written by Zheng Lu of EAS, Georgia Tech.