       t@lon2d   = f->TLONG
       t@lat2d   = f->TLAT
NCL Graphics: POP Grid to Lat/Lon Grid
Reminder: It is not required to regrid POP variables prior to
plotting. Simply attach TLAT and TLONG coordinate arrays as attributes to the variable
being plotted. NCL will use these coordinates.
EG: if variable "t" is to be plotted, do the following:
The interpolation of variables on POP grids to rectilinear
lat/lon grids and rectilinear lat/lon grids to POP grids is limited by the
existence of appropriate regrid weight files. See
the POP weight files page for more
details.
The regrid weight files used to perform the interpolates strictly apply to the surface only because the coefficients were developed so that the ocean and atmosphere models could communicate flux information. The topography reflects the surface (land, sea) only. If you try to plot a level deeper than the surface, you may get errors around boundaries (continents) since the surface topography is not necessarily applicable with depth. One way to mitigate this issue is to "normalize" the regridded data. This method is illustrated in Example #4.
The following libraries must be loaded for grid interpolation(s):
    load "$NCARG_ROOT/lib/ncarg/nclscripts/csm/contributed.ncl"
    load "$NCARG_ROOT/lib/ncarg/nclscripts/csm/popRemap.ncl"
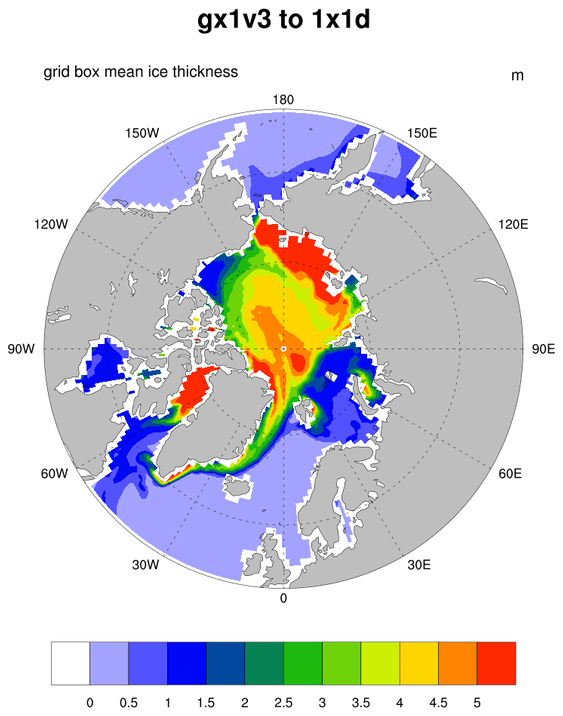
pop2lat_1.ncl:
Uses PopLatLon to convert the pop grid to a lat/lon grid.
The arguments are:
- variable e.g. "T"
- original grid name e.g. "gx3"
- output grid name e.g. "T62"
- weight method e.g. "bilin" or "aave" for bilinear or area averaged
- type of weights e.g. "da", for destarea, or "fa"
- time on grid file
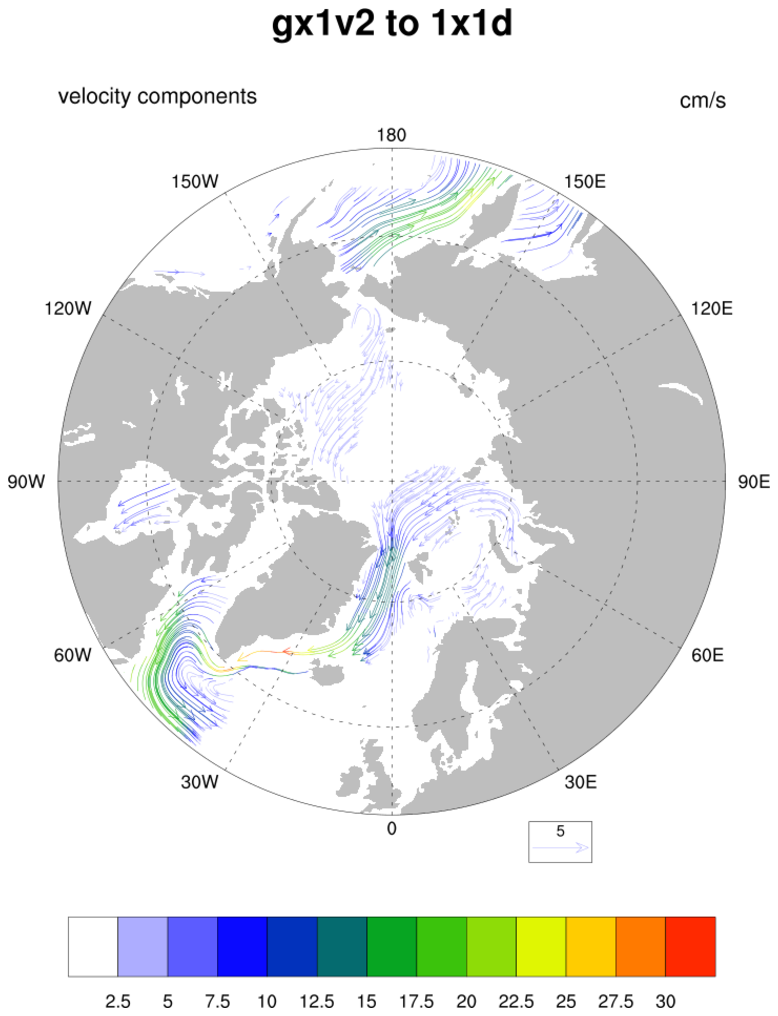 pop2lat_2.ncl:
Uses PopLatLonV to convert the vectors on the pop grid to a lat/lon grid.
The arguments are the same as example 1 above except that we pass in u and v.
 pop2lat_3.ncl:
A slice plot. After converting to a regular grid, coordinate subscripting can be used to select a specific latitude or longitude.
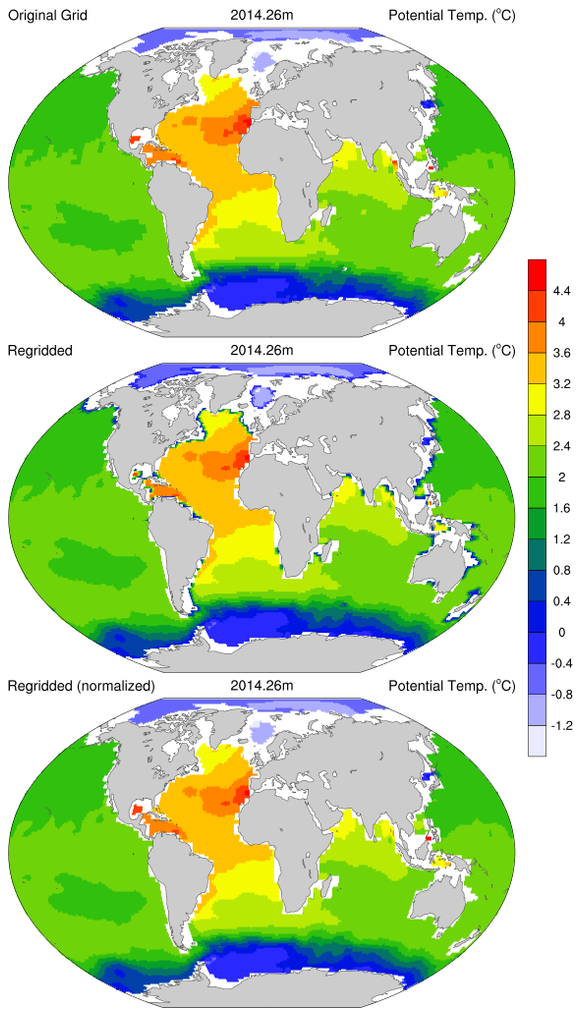
 pop2lat_4.ncl:
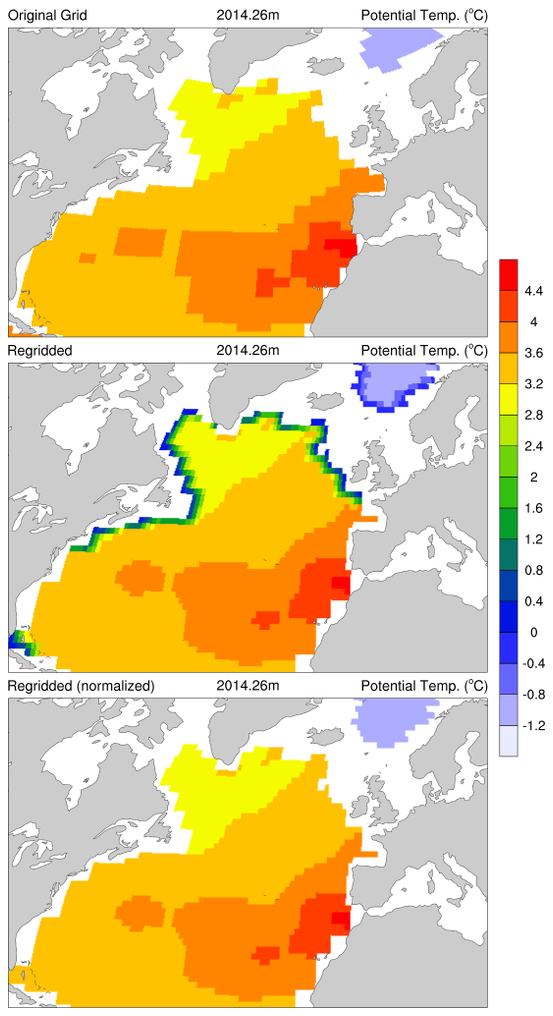
Shows how to eliminate errors along coastlines when regridding at depths other than the surface. The first paneled plot shows the data on the original POP grid (top), the data after regridding (middle), and the data after using the normalized regridding method (bottom). The second paneled plot shows the same data as the first but it is zoomed in on the North Atlantic.
Note the areas of incorrect data along the coastlines of eastern North America, the North Atlantic, Australia, and East Asia in the middle panel. Those areas are corrected in the normalize regridding method shown in the bottom panel, and explained below.
The normalized regridding method involves:
- Regrid the data on the POP grid to a regular lat/lon grid using PopLatLon.
- Take the original POP data array, and set it to 0 for land points and 1 for ocean points.
- Regrid the 0/1 array created in step 2) using PopLatLon.
- Using the dataset created in 3), set all areas that are = 0 to @_FillValue.
- Divide the regridded dataset created in step 1 by the normalized regridded dataset created in steps 3 and 4.