WARNING: The ROMS data set is NOT on a
native grid
even though the
data file contains info on how to plot it on a lambert conformal
projection. The data still needs to be transformed to that projection.
This is the default behavior of the plot templates.
These plots use the high resolution GMT
coastline. This
coastline does not bundled with NCL, but can be downloaded.
NCL Home>
Application examples>
Models ||
Data files for some examples
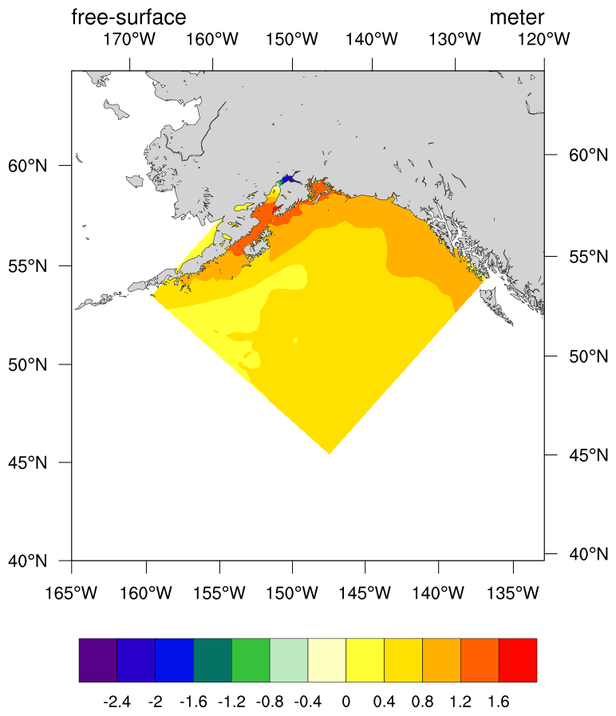
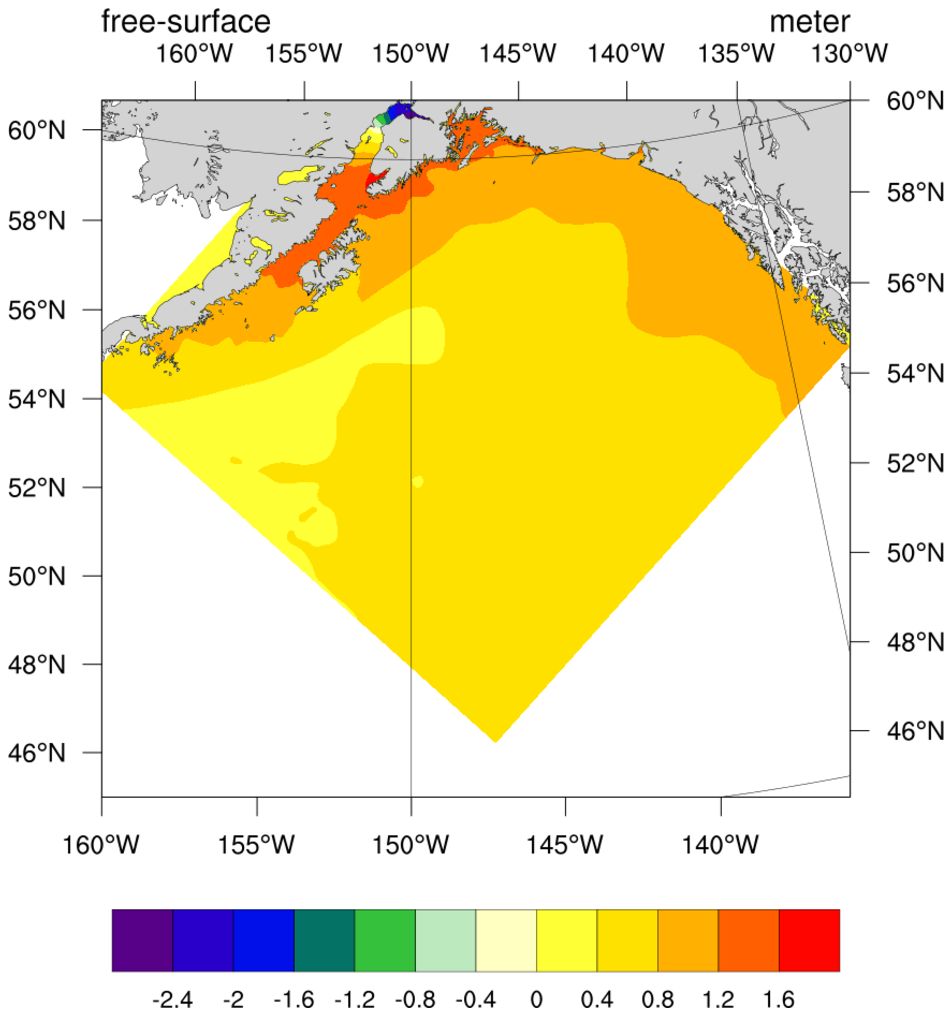
 roms_1.ncl:
Basic color plot of the data w/o any changes to the projection.
roms_1.ncl:
Basic color plot of the data w/o any changes to the projection.
ROMS data has 2D lat/lon coordinate info. We plot this differently than data with 1D coordinates. You need to set:
The three pieces of information that are required for a lambert conformal projection are: mpLambertParallel1F, mpLambertParallel2F, and mpLambertMeridianF
In order to zoom in on the Gulf of Alaska, we need to have the lower left and upper right corners of the grid. In our sample file this data was conveniently provided.
mpLeftCornerLatF, mpLeftCornerLonF, mpRightCornerLatF, and mpRightCornerLonF
 roms_2.ncl:
Changes the values of the corners provided by the model to zoom in
just slightly.
roms_2.ncl:
Changes the values of the corners provided by the model to zoom in
just slightly.
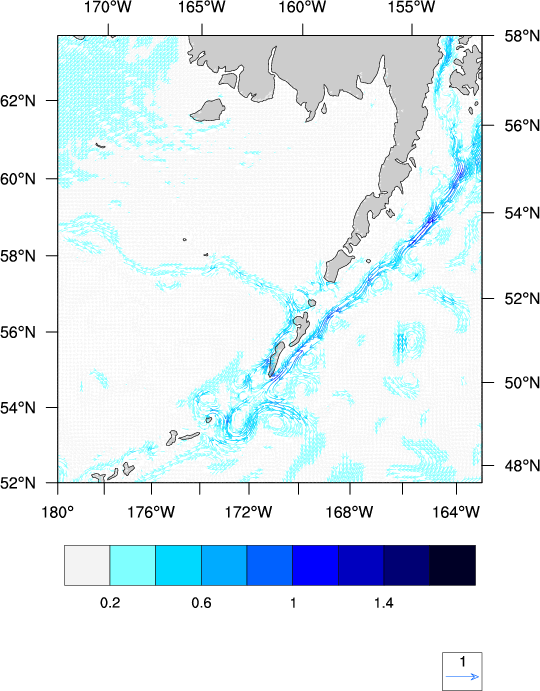
 roms_3.ncl:
Example of drawing vectors.
roms_3.ncl:
Example of drawing vectors.
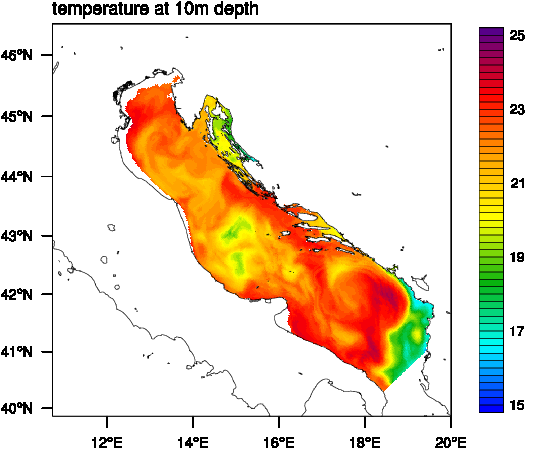
 roms_4.ncl:
Use the roms_3d_interp function located in the
ROMS_utils.ncl library to interpolate to a user specified level.
roms_4.ncl:
Use the roms_3d_interp function located in the
ROMS_utils.ncl library to interpolate to a user specified level.
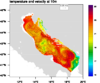 roms_5.ncl:
Similar to the previous example but has a velocity overlay.
Note: roms_3d_interp is working on "rho" coords. If you specify
variable "u" or "v" it is transfering them first to the "rho"
and than interpolate.
roms_5.ncl:
Similar to the previous example but has a velocity overlay.
Note: roms_3d_interp is working on "rho" coords. If you specify
variable "u" or "v" it is transfering them first to the "rho"
and than interpolate.
Example pages containing: tips | resources | functions/procedures
NCL: ROMS
Ivica Janekovic (Rudjer Boskovic Institute, Zagreb, Croatia) has donated an
NCL library of functions that facilitate writing cleaner scripts. The library
is named ROMS_utils.ncl. The library may be downloaded here.
The contents of the ROMS_utils.ncl library can be viewed via
%> less ROMS_utils.ncl
 roms_1.ncl:
Basic color plot of the data w/o any changes to the projection.
roms_1.ncl:
Basic color plot of the data w/o any changes to the projection.ROMS data has 2D lat/lon coordinate info. We plot this differently than data with 1D coordinates. You need to set:
       lat2d     = f->lat-array
       lon2d     = f->lon_array
       t@lon2d   = lon2d
       t@lat2d   = lat2d
Where the the lat/lon arrays are particular to the variable, e.g. lat_rho
The three pieces of information that are required for a lambert conformal projection are: mpLambertParallel1F, mpLambertParallel2F, and mpLambertMeridianF
In order to zoom in on the Gulf of Alaska, we need to have the lower left and upper right corners of the grid. In our sample file this data was conveniently provided.
mpLeftCornerLatF, mpLeftCornerLonF, mpRightCornerLatF, and mpRightCornerLonF
 roms_2.ncl:
Changes the values of the corners provided by the model to zoom in
just slightly.
roms_2.ncl:
Changes the values of the corners provided by the model to zoom in
just slightly.
 roms_3.ncl:
Example of drawing vectors.
roms_3.ncl:
Example of drawing vectors.
 roms_4.ncl:
Use the roms_3d_interp function located in the
ROMS_utils.ncl library to interpolate to a user specified level.
roms_4.ncl:
Use the roms_3d_interp function located in the
ROMS_utils.ncl library to interpolate to a user specified level.
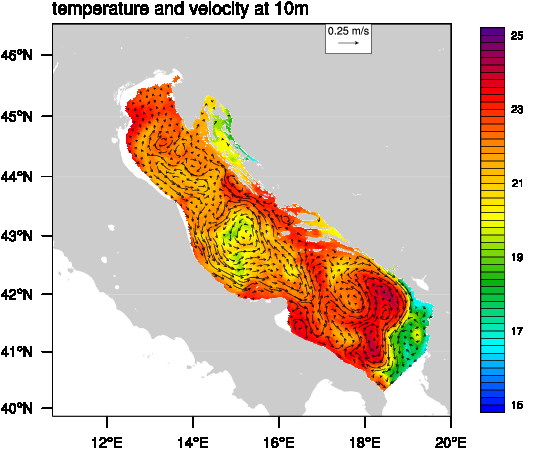 roms_5.ncl:
Similar to the previous example but has a velocity overlay.
Note: roms_3d_interp is working on "rho" coords. If you specify
variable "u" or "v" it is transfering them first to the "rho"
and than interpolate.
roms_5.ncl:
Similar to the previous example but has a velocity overlay.
Note: roms_3d_interp is working on "rho" coords. If you specify
variable "u" or "v" it is transfering them first to the "rho"
and than interpolate.