NCL Home>
Application examples>
Models ||
Data files for some examples
Example pages containing:
tips |
resources |
functions/procedures
NCL Graphics: Plotting WRF-ARW data using NCL
WEATHER RESEARCH
AND FORECASTING (WRF) MODEL
[WRF
ARW OnLine Tutorial |
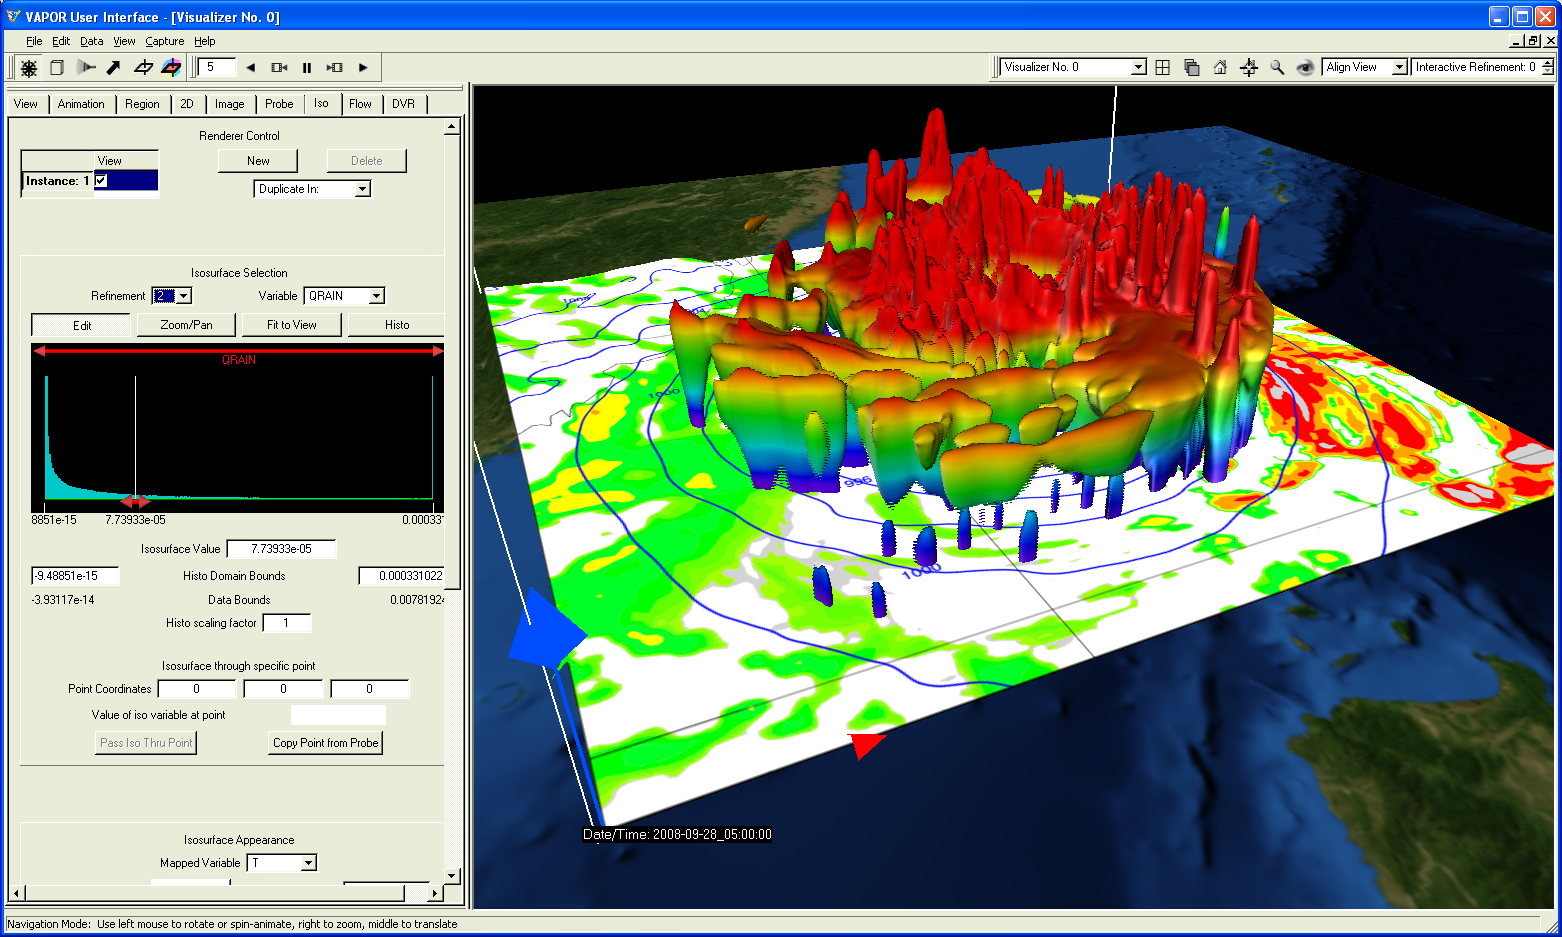
WRF-VAPOR
| WRF Support Forum]
This page describes how to use NCL to read and plot data and
diagnostics calculated from WRF-ARW files.
To read WRF ARW data and/or calculate certain diagnostics, you need
two functions:
- addfile - this function opens a WRF-ARW NetCDF
file so you can read data or calculate diagnostics. If you have more
than one WRF-ARW file, use addfiles.
- wrf_user_getvar - given the
file(s) you opened in the first step, this function allows you to
specify what diagnostic you want to calculate or what variable you
want to read.
Once you have read a variable or calculated a diagnostic, there are
two different sets of routines you can use for plotting WRF-ARW data:
- WRF-specific plotting functions
The folks who help develop the WRF model have created their own
tutorial for plotting data using the the WRF-specific plotting
functions. See the
the WRF
ARW OnLine Tutorial web page.
- gsn_csm plotting functions
The example pages linked to from this page mainly show how to plot data using
gsn_csm functions, although in some cases the WRF-specific routines are also used
for comparison purposes. As an example, see the "wrf_gsn_1.ncl" and "wrf_nogsn_1.ncl"
scripts on the WRF gsn_csm examples page.
There are other packages developed at NCAR for analyzing and
visualizing WRF-ARW data:
Mark Seefeldt [U. Colorado: Cooperative Institute for Research in Environmental Sciences (CIRES)]
has created an NCL based script,
wrfout_to_cf that creates new Climate-and-Forecast (CF) based
NetCDF files from native wrfout NetCDF files. The script is well-documented and is easy to configure and run.
WRF-ARW netCDF files are
different from netCDF files produced by the component models of
the
Community Earth System Model
(CESM).
For example, the CESM grids do not change with time, while the WRF
model(s) allow for this possibility by making the latitude and
longitude arrays a function of time. NCL can readily read and process
WRF netCDF files. However, some software processing tools may require
data files to be
Climate and Forecast (CF)
convention conformant.
WRF-related questions should be addressed on
the WRF Support Form.
NCL-related questions should be sent
to ncl-talk.
Note about WRF-NMM data: WRF-NMM can be plotted with NCL after you
used the WPP code to convert to grib format. The wrf_xxx
computational functions in theory can be used for any model - although they
have not been tested. The problem is that all the wrf_xxx
plotting scripts have been written exclusively for WRF-ARW, and
that is because the scripts handle the projection change from C to A,
and also the map information. Since WRF-NMM is on a rotated E grid,
the map information is very complicated to deal with.
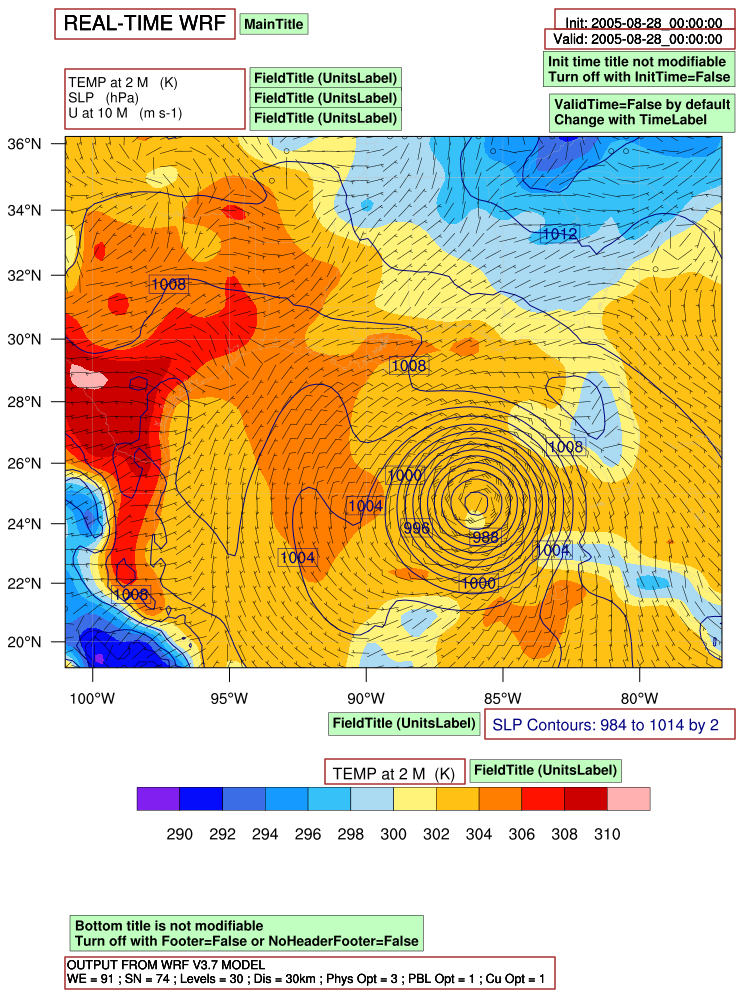
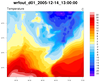 Plotting WRF with gsn_csm
: This
page shows examples of using gsn_csm scripts to plot WRF-ARW
data.
Many of the examples also include a WRF-specific plotting
version of the script so you can compare the two methods.
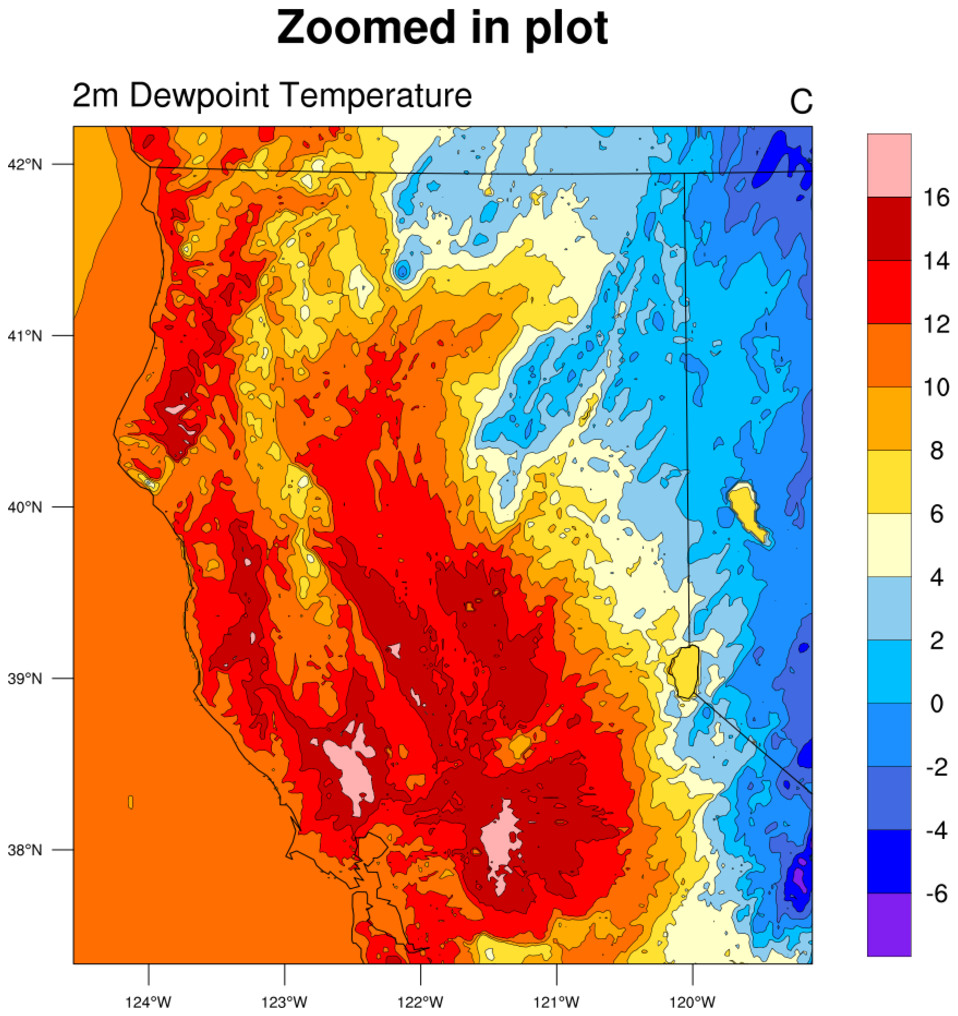
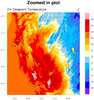 Zooming
: This page
shows how to zoom in on WRF data plotted over maps.
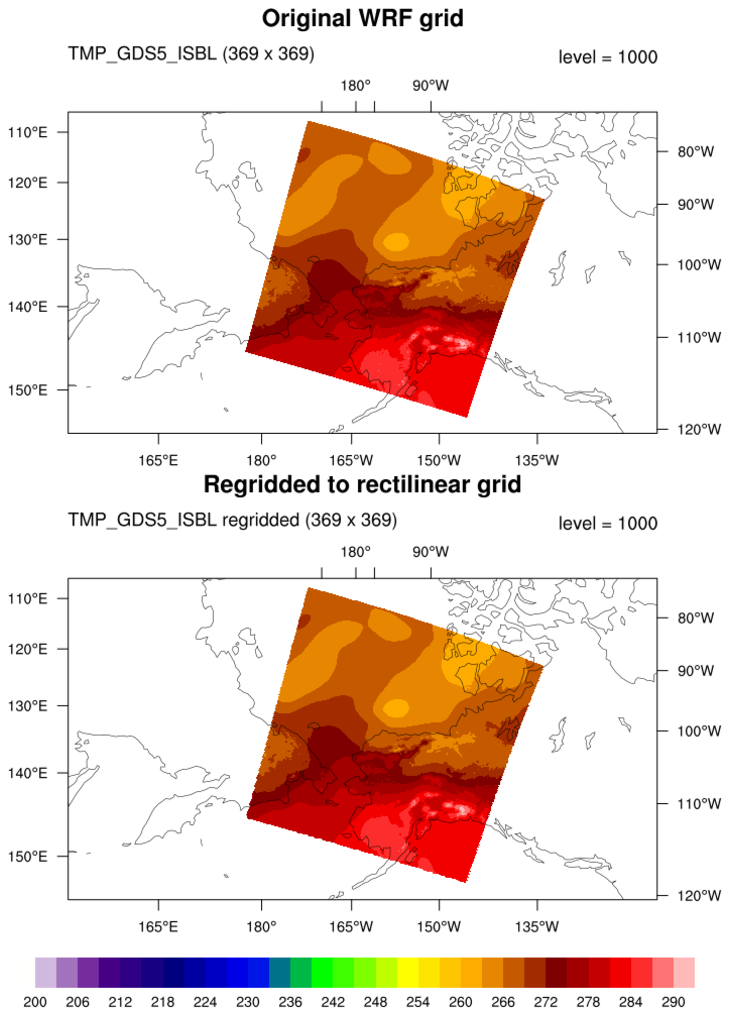
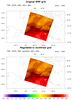 Regridding
: This page
shows how to regrid data from one grid or mesh, to another grid or mesh.
This page is not limited to just WRF data.
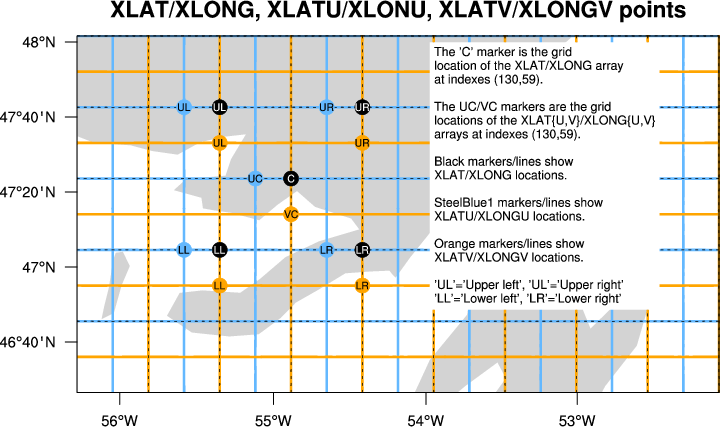
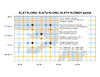 Debugging:
: This page
provides some graphical scripts to help you understand
WRF grids and to debug problems you might run into.
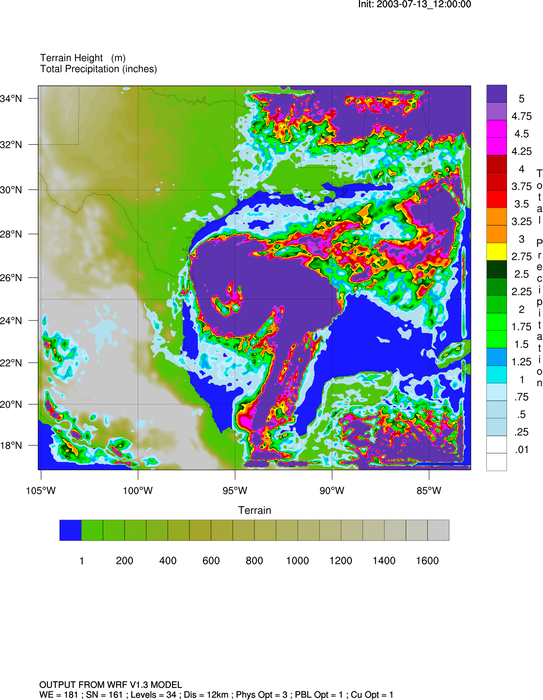
 Precipitation
: This page shows how to create
precipitation contour plots.
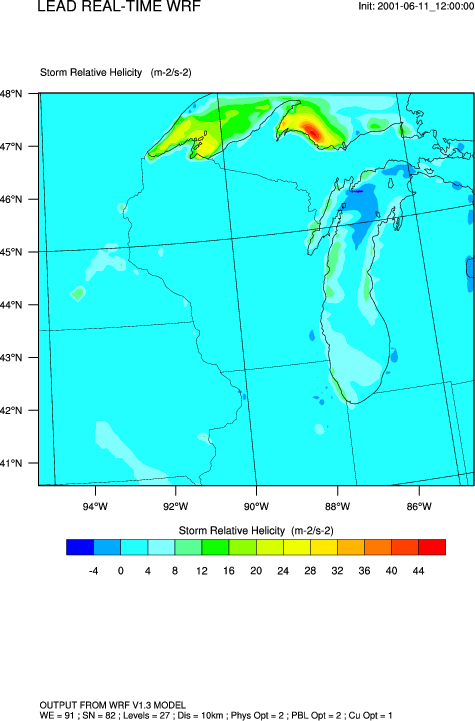
 Helicity
:
This page shows how to create helicity plots.
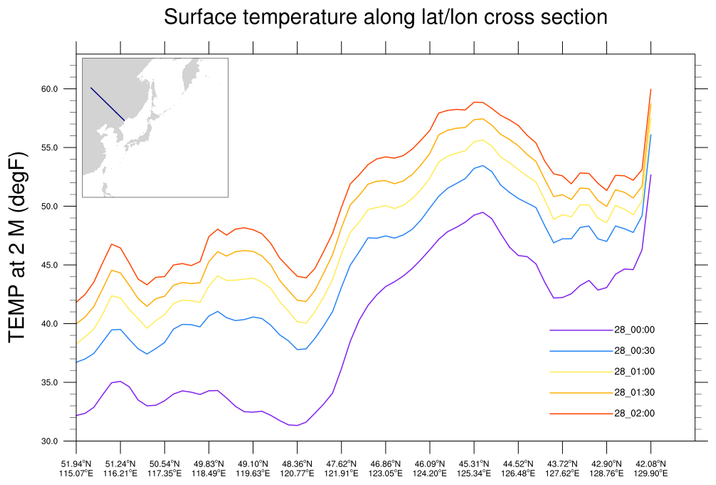
 XY
XY: This page shows how to create
basic XY plots using
gsn_csm_xy.
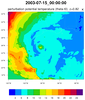
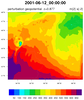 Lambert
: This page
shows how to plot WRF-ARW data that is on a native
Lambert Conformal projection.
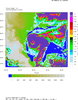
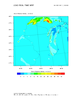
 Mercator
: This page
shows how to plot WRF-ARW data that is on a native
Mercator projection.
