NCL Home>
Application examples>
Data sets ||
Data files for some examples
 cru_1.ncl: A basic plot of the January (1961-90) climatology.
gsn_csm_contour_map is
the plot interface that creates a cylindrical equidistant plot.
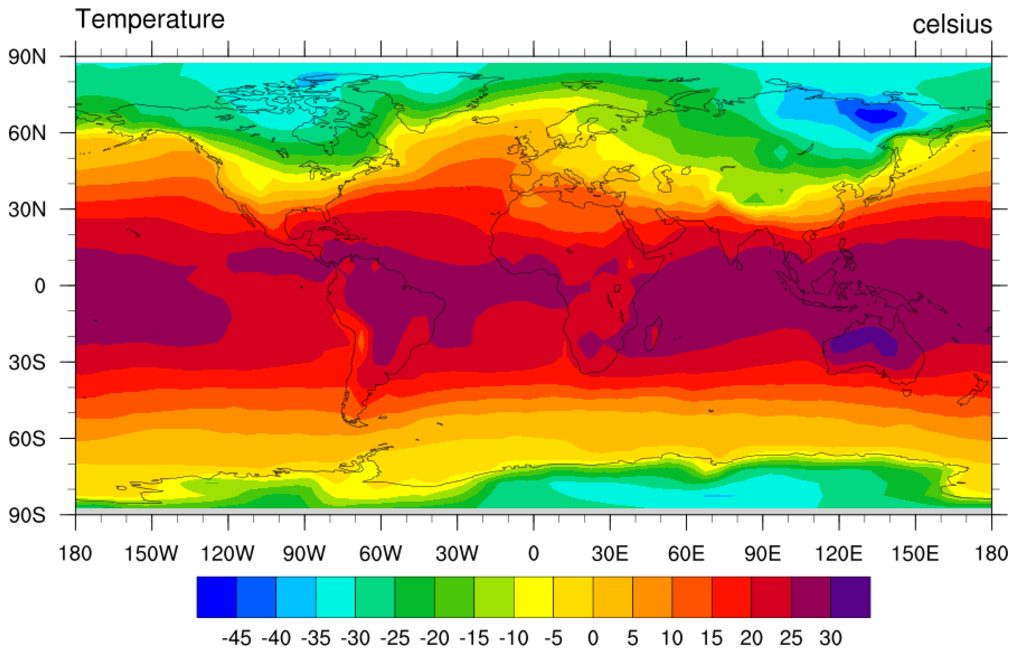
cru_1.ncl: A basic plot of the January (1961-90) climatology.
gsn_csm_contour_map is
the plot interface that creates a cylindrical equidistant plot.
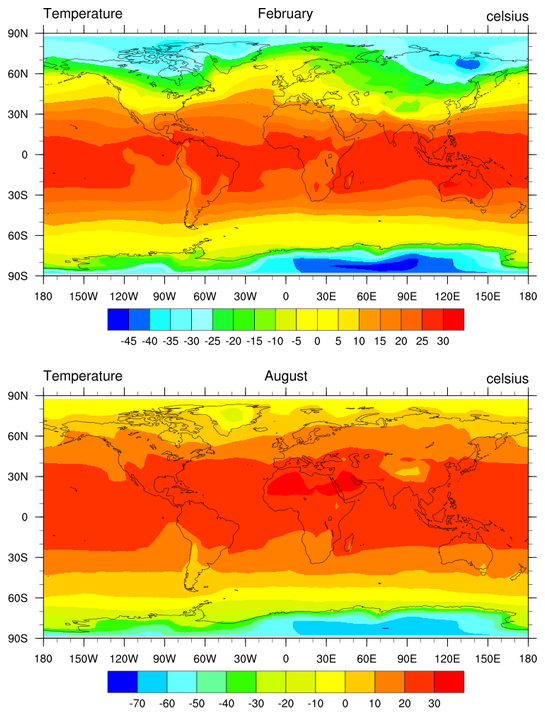
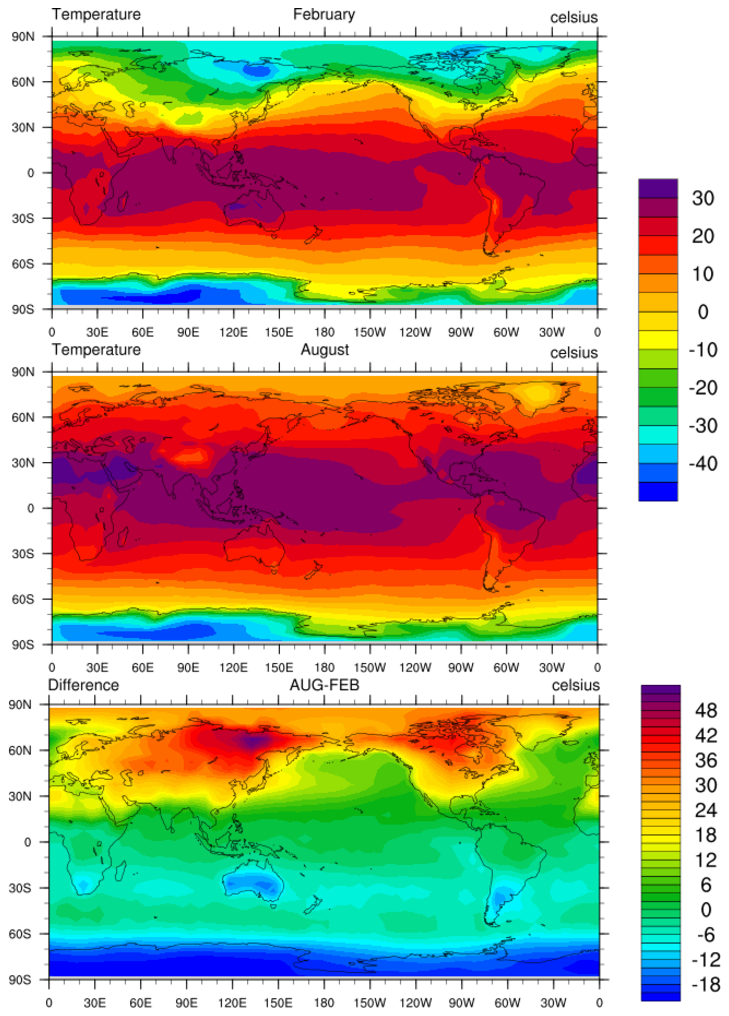
 cru_2.ncl:
A simple panel plot showing a February and August climatology.
cru_2.ncl:
A simple panel plot showing a February and August climatology.
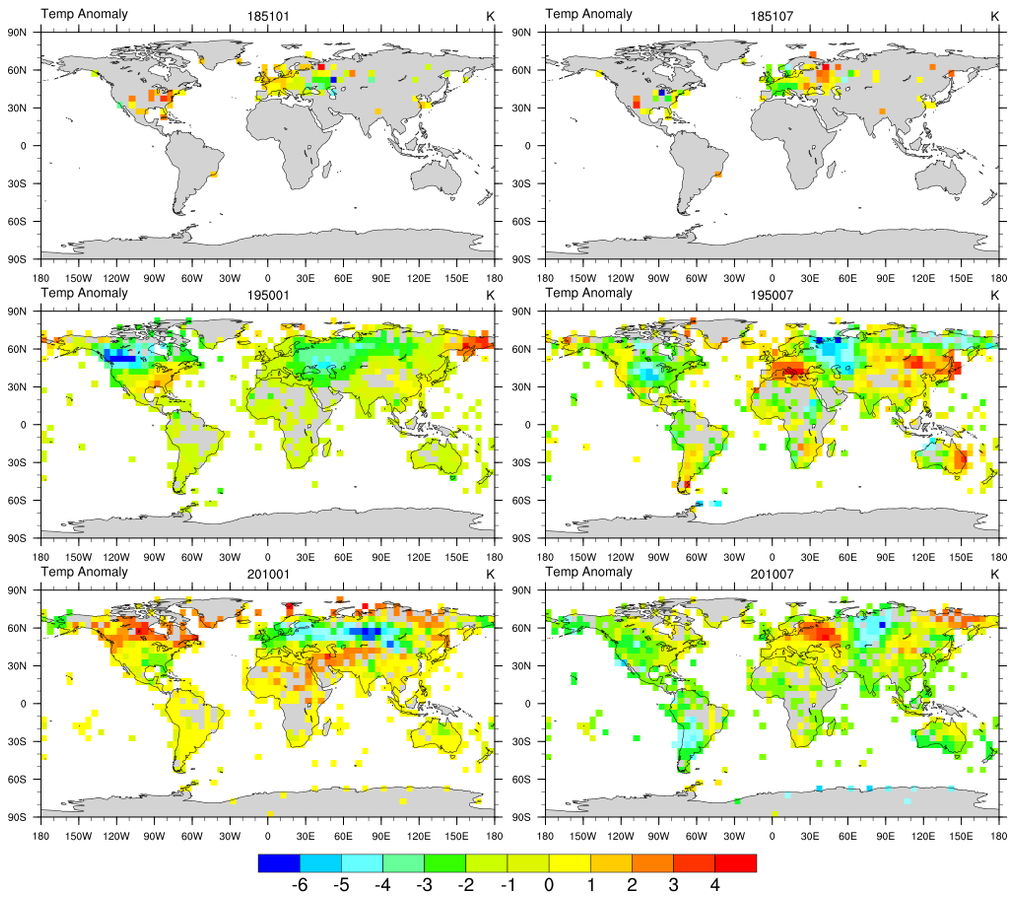
 cru_4.ncl:
Variance adjusted temperature anomalies [CRUTEM4v] for arbitrarily
specified dates. This reveals the change in station coverage over time.
cru_4.ncl:
Variance adjusted temperature anomalies [CRUTEM4v] for arbitrarily
specified dates. This reveals the change in station coverage over time.
 cru_5.ncl:
Same as example example 4 but from the
Hadley Center's land/sea median anomalies [hadcrut4_median].
cru_5.ncl:
Same as example example 4 but from the
Hadley Center's land/sea median anomalies [hadcrut4_median].
 cru_6.ncl:
Creates a bar chart of certain variables.
cru_6.ncl:
Creates a bar chart of certain variables.
 cru_7.ncl:
Read/plot the 'self calibrating PDSI.' The data span 1901-2002.
There are separate files for the USA and Europe. The original ascii files
were converted to netCDF for convenience and to faciliate
use by many tools. The script plots the USA but just changing the
input file to the one for Europe will yield a Europe plot.
cru_7.ncl:
Read/plot the 'self calibrating PDSI.' The data span 1901-2002.
There are separate files for the USA and Europe. The original ascii files
were converted to netCDF for convenience and to faciliate
use by many tools. The script plots the USA but just changing the
input file to the one for Europe will yield a Europe plot.
 cru_8.ncl:
Read the
CRU-TS3.21
gridded variables for an arbitrarily specified time period; calculate a monthly climatology;
plot all variables using (essentially) default graphical options.
The monthly variables include precipitation (PRE),
maximum (TMX), minimum (TMN) and average (TMP) temperatures,
diurnal temperature range (DTR), cloud cover (CLD), vapor pressure (VAP),
wet frequenct (WET), ground frost frequency( FRS) and potential
evaporation (PET). The PET uses a variant of the Penman-Monteith method
which is superior to the 'classic' Thorntwaite method.
cru_8.ncl:
Read the
CRU-TS3.21
gridded variables for an arbitrarily specified time period; calculate a monthly climatology;
plot all variables using (essentially) default graphical options.
The monthly variables include precipitation (PRE),
maximum (TMX), minimum (TMN) and average (TMP) temperatures,
diurnal temperature range (DTR), cloud cover (CLD), vapor pressure (VAP),
wet frequenct (WET), ground frost frequency( FRS) and potential
evaporation (PET). The PET uses a variant of the Penman-Monteith method
which is superior to the 'classic' Thorntwaite method.
Example pages containing:
tips |
resources |
functions/procedures
NCL Graphics: Climate Research Unit (CRU) Data
The Climatic Research Unit
is an institution concerned with the study of natural and
anthropogenic climate change.
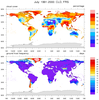
 cru_1.ncl: A basic plot of the January (1961-90) climatology.
gsn_csm_contour_map is
the plot interface that creates a cylindrical equidistant plot.
cru_1.ncl: A basic plot of the January (1961-90) climatology.
gsn_csm_contour_map is
the plot interface that creates a cylindrical equidistant plot.
The original data is of type short, which must be converted to type float before use. We use the short2flt function to do this.
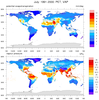
cru_2.ncl:
A simple panel plot showing a February and August climatology.
gsn_panel is the function that allows you to put more than one plot on a page. There are many more panel examples to review and learn from.
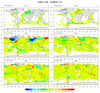
 cru_4.ncl:
Variance adjusted temperature anomalies [CRUTEM4v] for arbitrarily
specified dates. This reveals the change in station coverage over time.
cru_4.ncl:
Variance adjusted temperature anomalies [CRUTEM4v] for arbitrarily
specified dates. This reveals the change in station coverage over time.
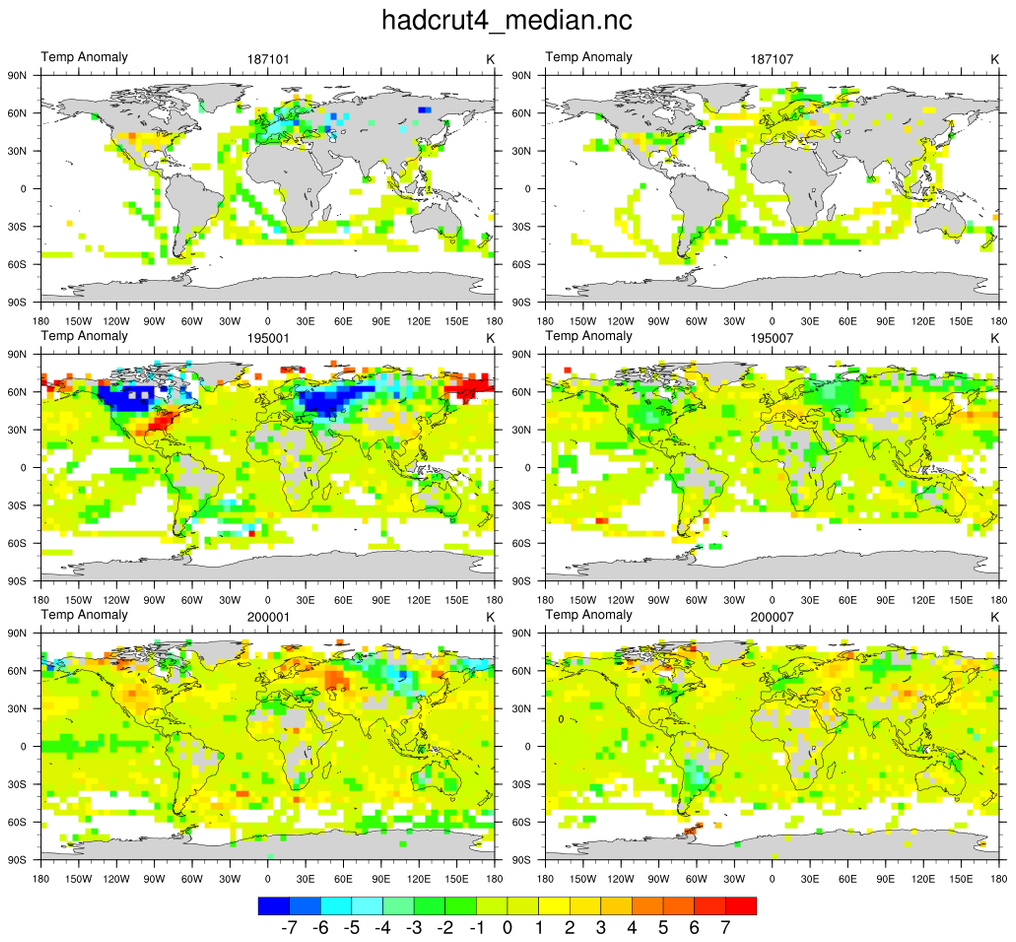 cru_5.ncl:
Same as example example 4 but from the
Hadley Center's land/sea median anomalies [hadcrut4_median].
cru_5.ncl:
Same as example example 4 but from the
Hadley Center's land/sea median anomalies [hadcrut4_median].
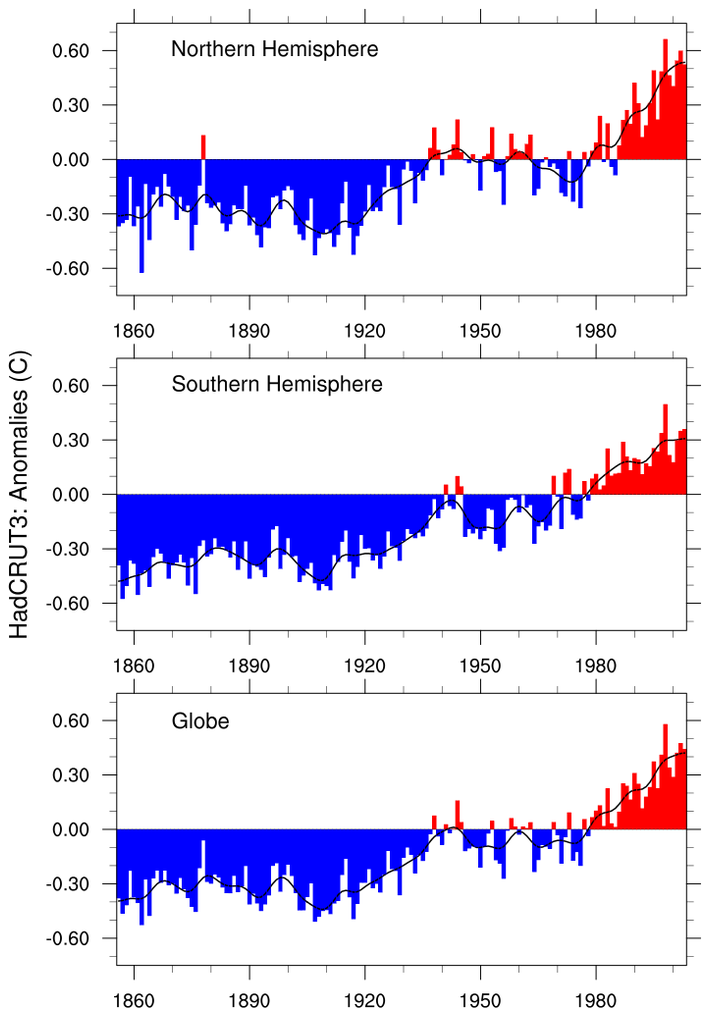
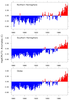
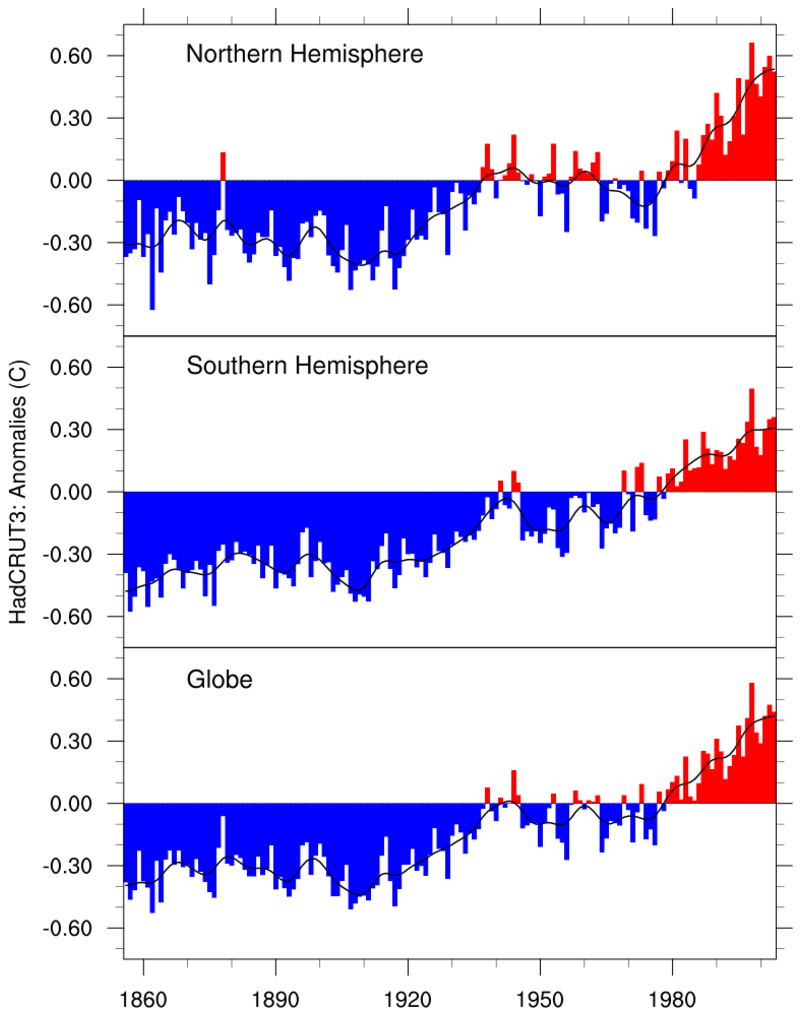 cru_6.ncl:
Creates a bar chart of certain variables.
cru_6.ncl:
Creates a bar chart of certain variables.
There are many ways to draw bar charts. The leftmost is straight forward: draw base bar chart, add text and add line. The right plot show how to merge the various plots.
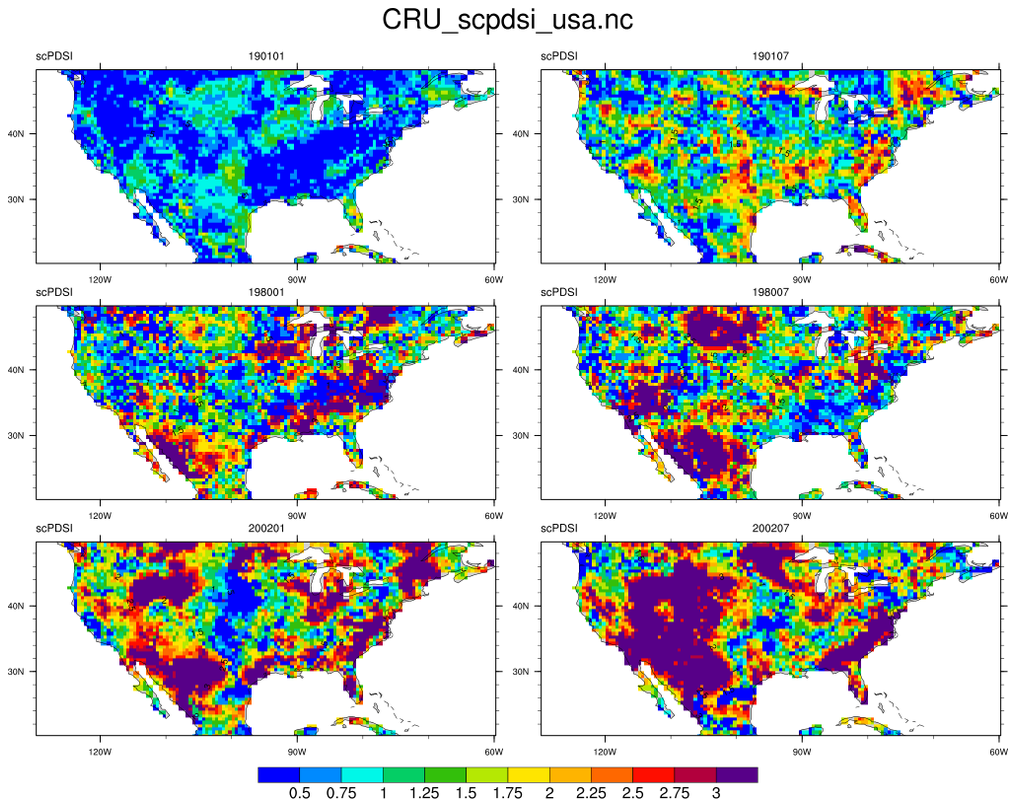
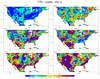
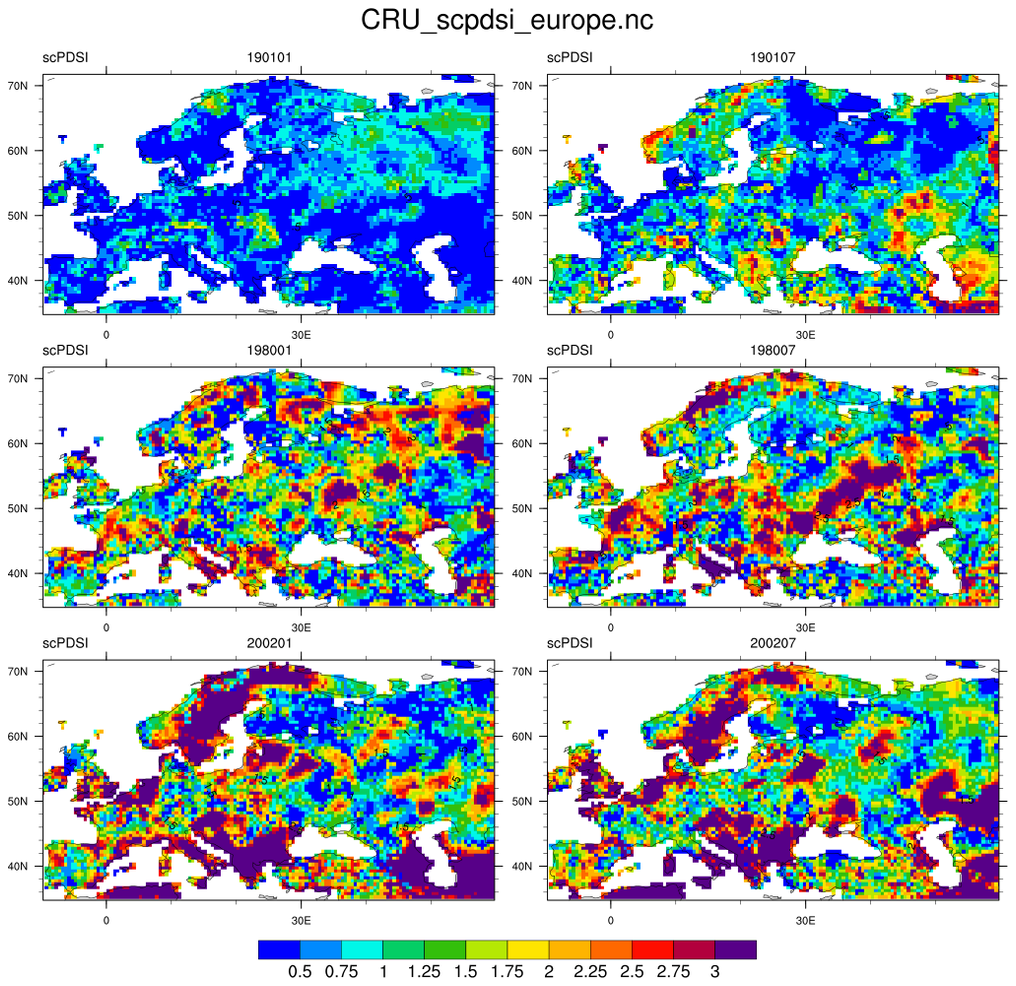 cru_7.ncl:
Read/plot the 'self calibrating PDSI.' The data span 1901-2002.
There are separate files for the USA and Europe. The original ascii files
were converted to netCDF for convenience and to faciliate
use by many tools. The script plots the USA but just changing the
input file to the one for Europe will yield a Europe plot.
cru_7.ncl:
Read/plot the 'self calibrating PDSI.' The data span 1901-2002.
There are separate files for the USA and Europe. The original ascii files
were converted to netCDF for convenience and to faciliate
use by many tools. The script plots the USA but just changing the
input file to the one for Europe will yield a Europe plot.
The scripts to convert the ascii CRU 2.1 formatted files to netCDF are asc2nc.cru_scpdsi_europe.ncl and asc2nc.cru_scpdsi_usa.ncl.
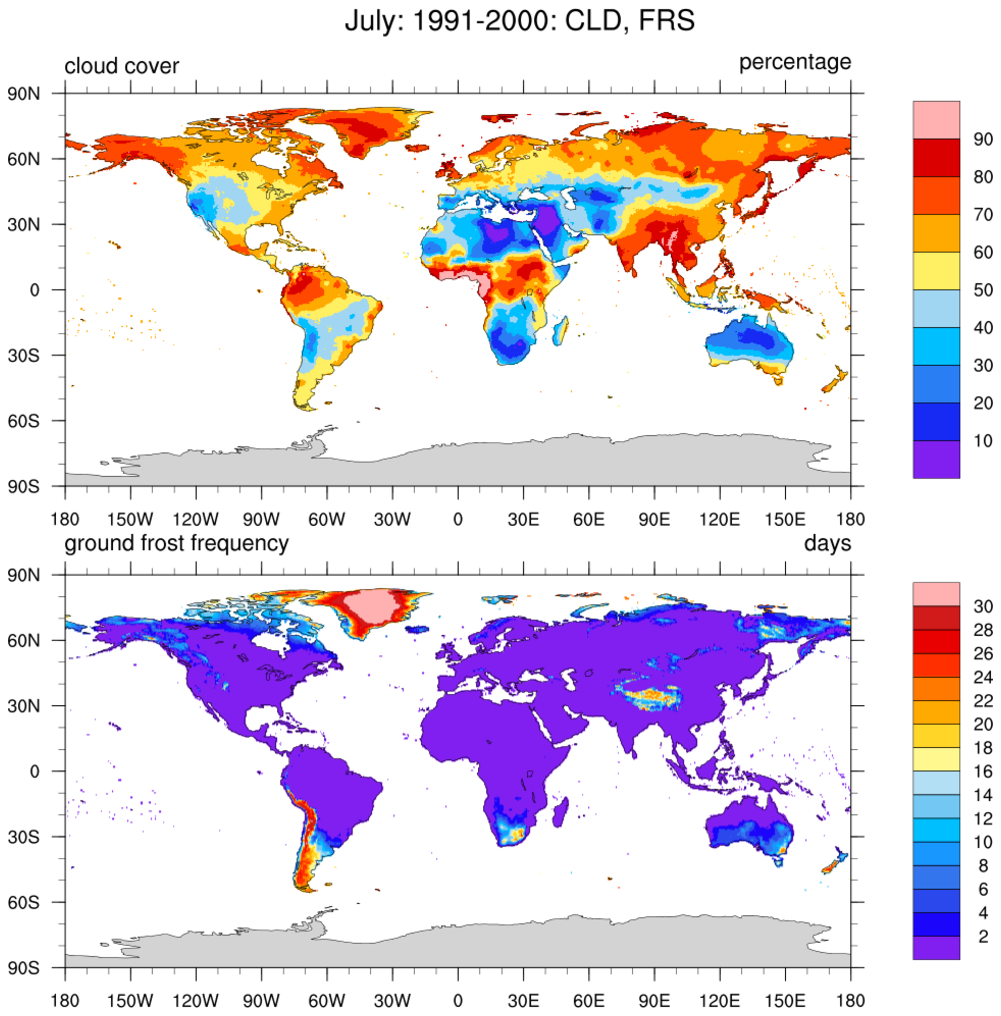

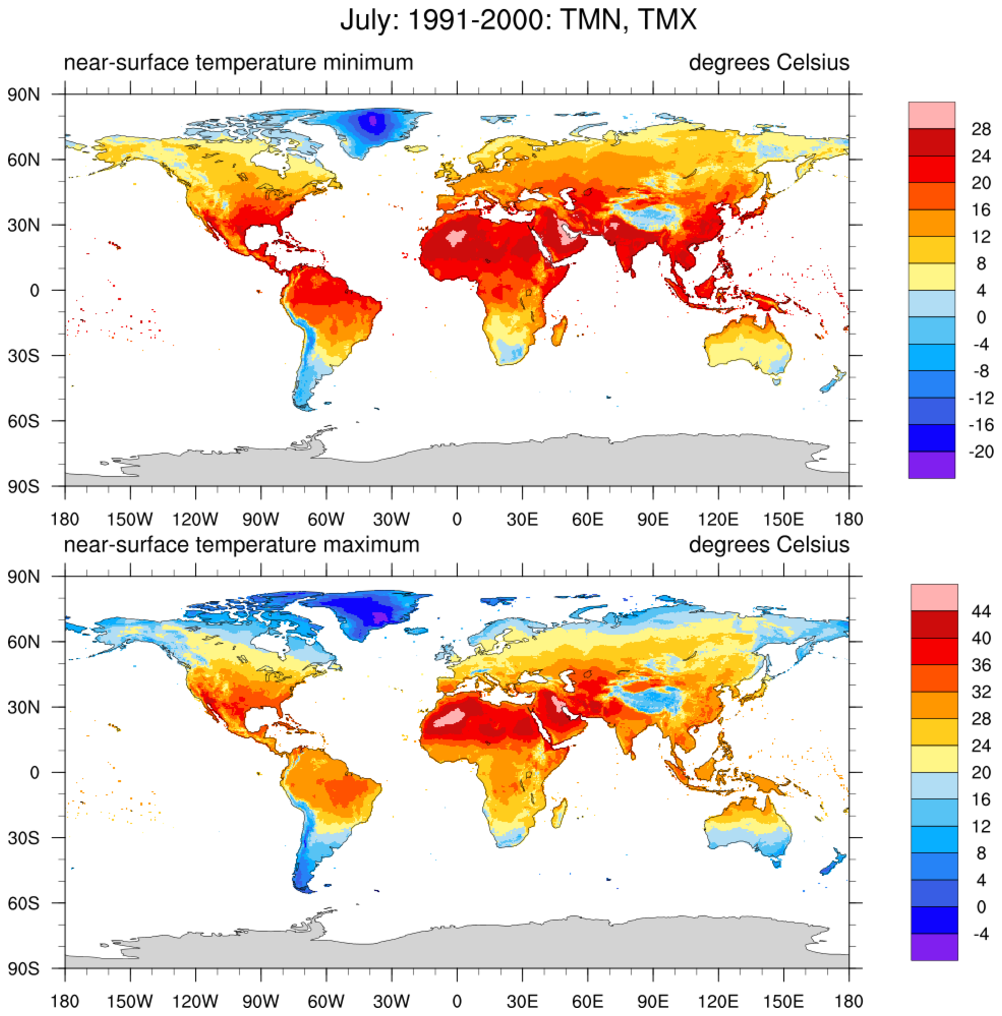
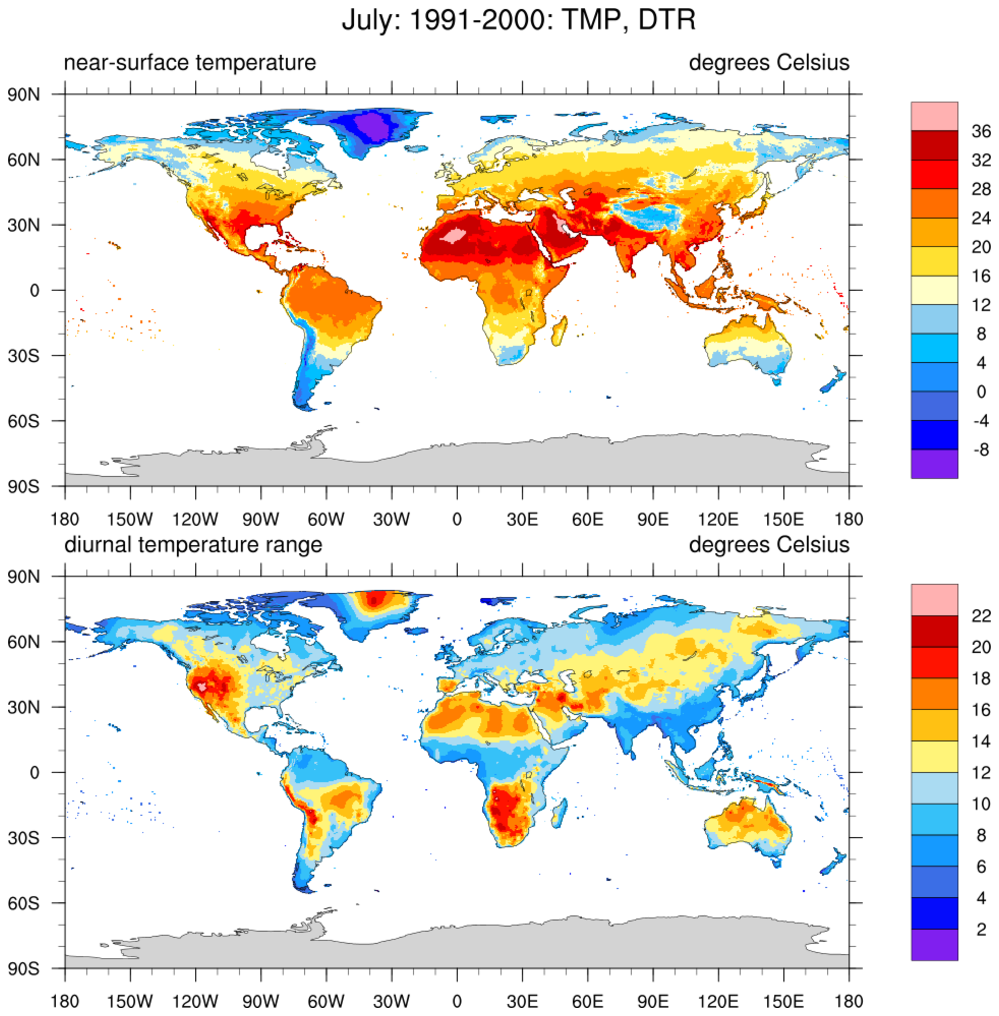
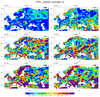
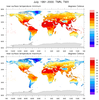
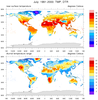
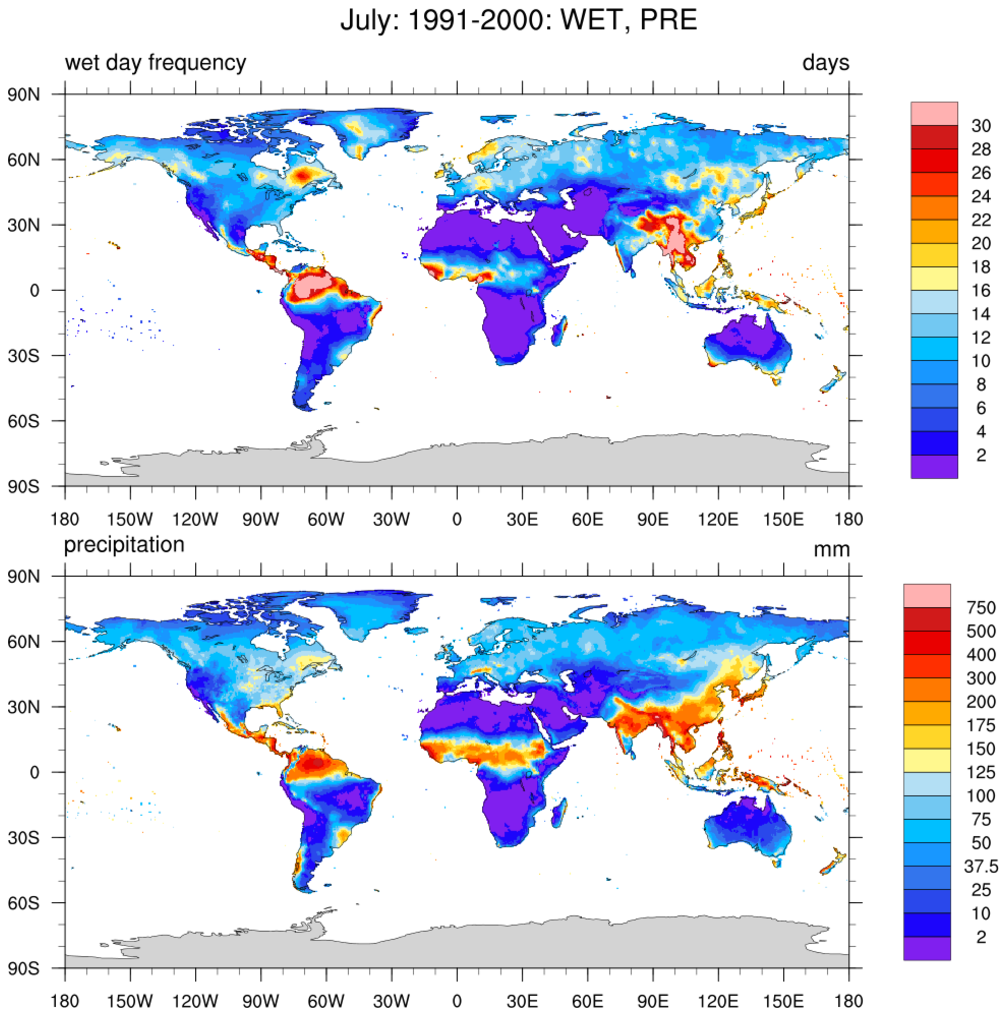 cru_8.ncl:
Read the
CRU-TS3.21
gridded variables for an arbitrarily specified time period; calculate a monthly climatology;
plot all variables using (essentially) default graphical options.
The monthly variables include precipitation (PRE),
maximum (TMX), minimum (TMN) and average (TMP) temperatures,
diurnal temperature range (DTR), cloud cover (CLD), vapor pressure (VAP),
wet frequenct (WET), ground frost frequency( FRS) and potential
evaporation (PET). The PET uses a variant of the Penman-Monteith method
which is superior to the 'classic' Thorntwaite method.
cru_8.ncl:
Read the
CRU-TS3.21
gridded variables for an arbitrarily specified time period; calculate a monthly climatology;
plot all variables using (essentially) default graphical options.
The monthly variables include precipitation (PRE),
maximum (TMX), minimum (TMN) and average (TMP) temperatures,
diurnal temperature range (DTR), cloud cover (CLD), vapor pressure (VAP),
wet frequenct (WET), ground frost frequency( FRS) and potential
evaporation (PET). The PET uses a variant of the Penman-Monteith method
which is superior to the 'classic' Thorntwaite method.
Reference:

Harris, I., Jones, P.D., Osborn, T.J. and Lister, D.H. (2013)
Updated high-resolution grids of monthly climatic observations - the CRU TS3.10 Dataset.
International Journal of Climatology
Volume 34, Issue 3, pages 623-642, 15 March 2014

http://dx.doi.org/10.1002/joc.3711